Marketplace Earnings Dashboard
The Marketplace Earnings Dashboard provides agencies with a clear and centralized view of app performance across their client base. It brings together key data points—such as installs, revenue, costs, and profit—so you can easily monitor performance and make informed, data-driven decisions about app usage and return on investment.
Why It Matters
Having a clear view of both financial performance and app adoption allows agencies to better understand the value delivered to clients. With this dashboard, you can:
- Evaluate the effectiveness of Marketplace apps
- Identify opportunities to optimize usage and improve ROI
- Make more informed decisions around client strategy and app offerings
- Reduce the need for manual tracking and reporting
How to Enable
To access the Marketplace Earnings Dashboard:
Navigate to Labs, select Agency, and Enable Marketplace Earnings Dashboard
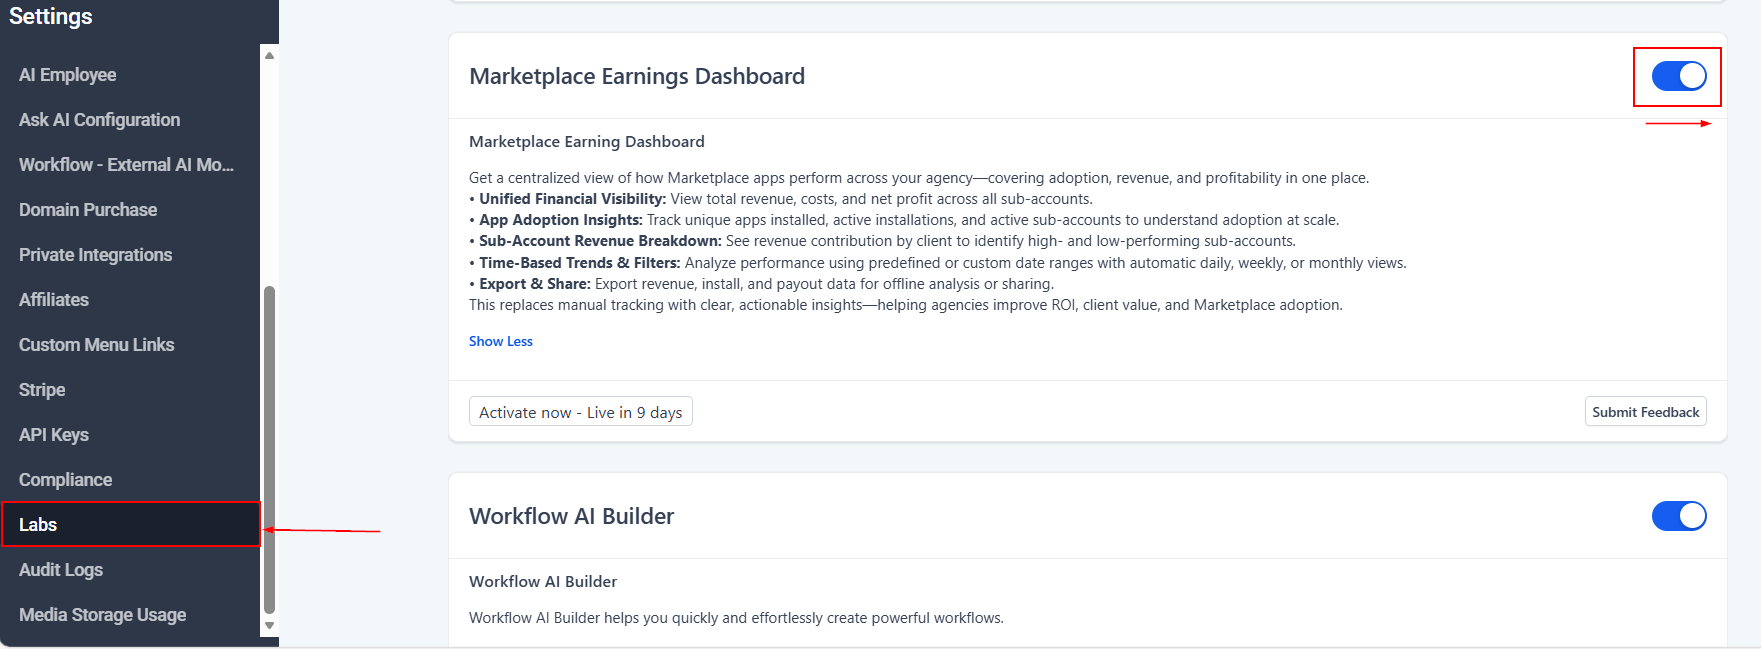
Once enabled, it will appear as a sub-module within the Marketplace section.
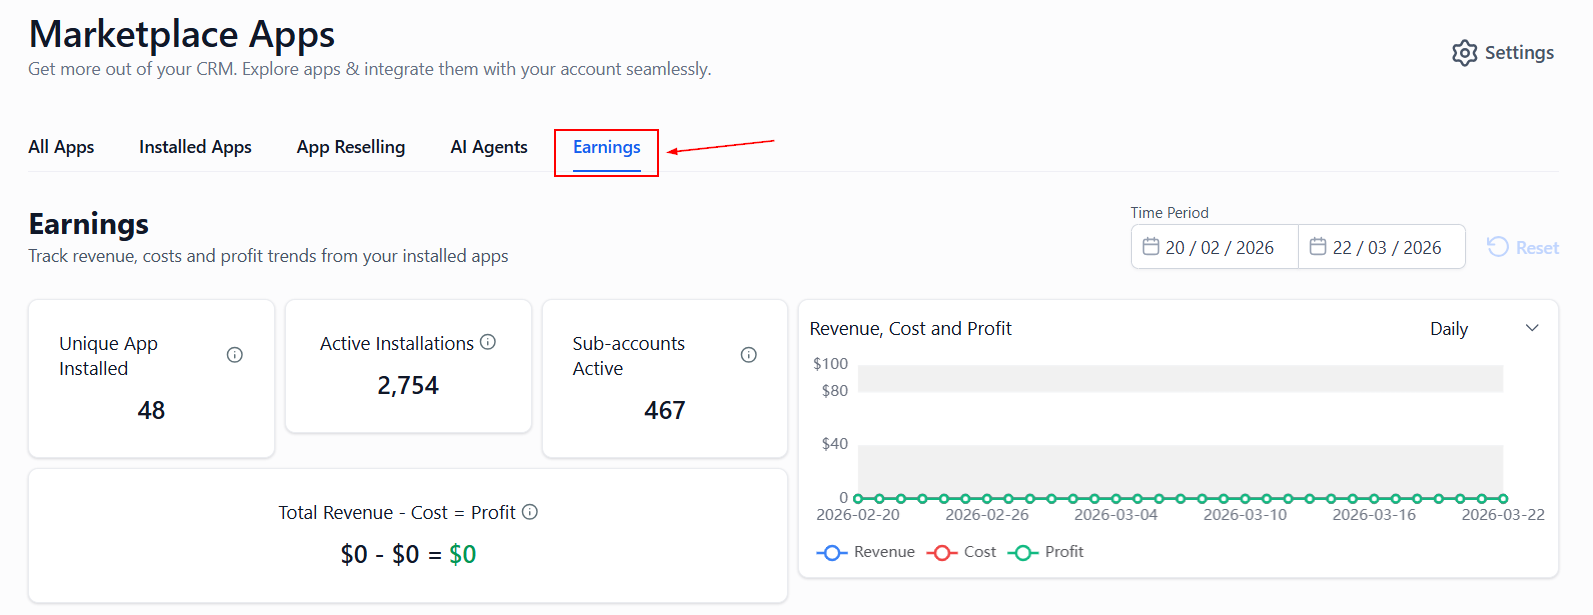
Overview
Time-Based Insights
The dashboard includes flexible time filters to help you analyze trends. Use predefined ranges (e.g., Last 30 Days, This Month) or custom date ranges to narrow your search.
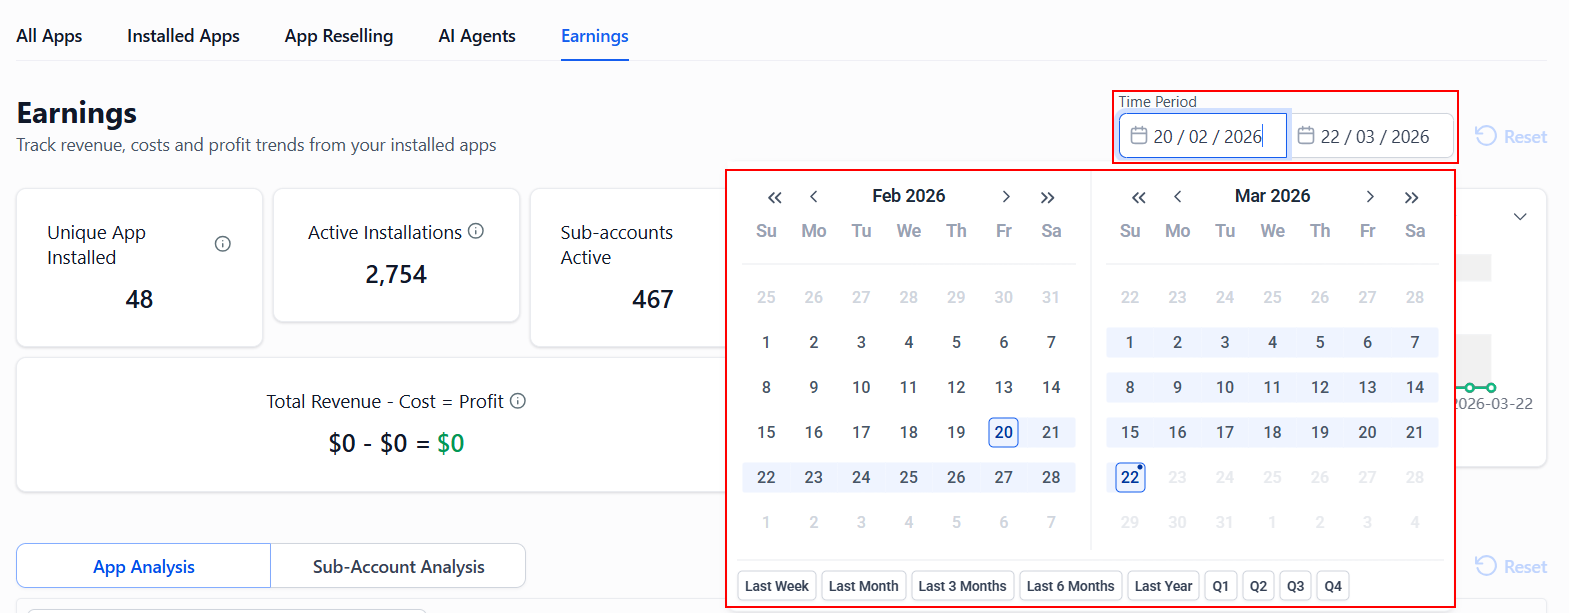
Visualizations automatically adjust their granularity (daily, weekly, or monthly) based on the selected time window, ensuring data remains easy to interpret.
App Adoption Metrics
Gain insight into how apps are being used across your accounts with key adoption indicators:
- Unique Apps Installed: The number of distinct apps installed across all sub-accounts
- Active Installations: The total number of active app installs
- Active Sub-Accounts: The number of sub-accounts with at least one active install
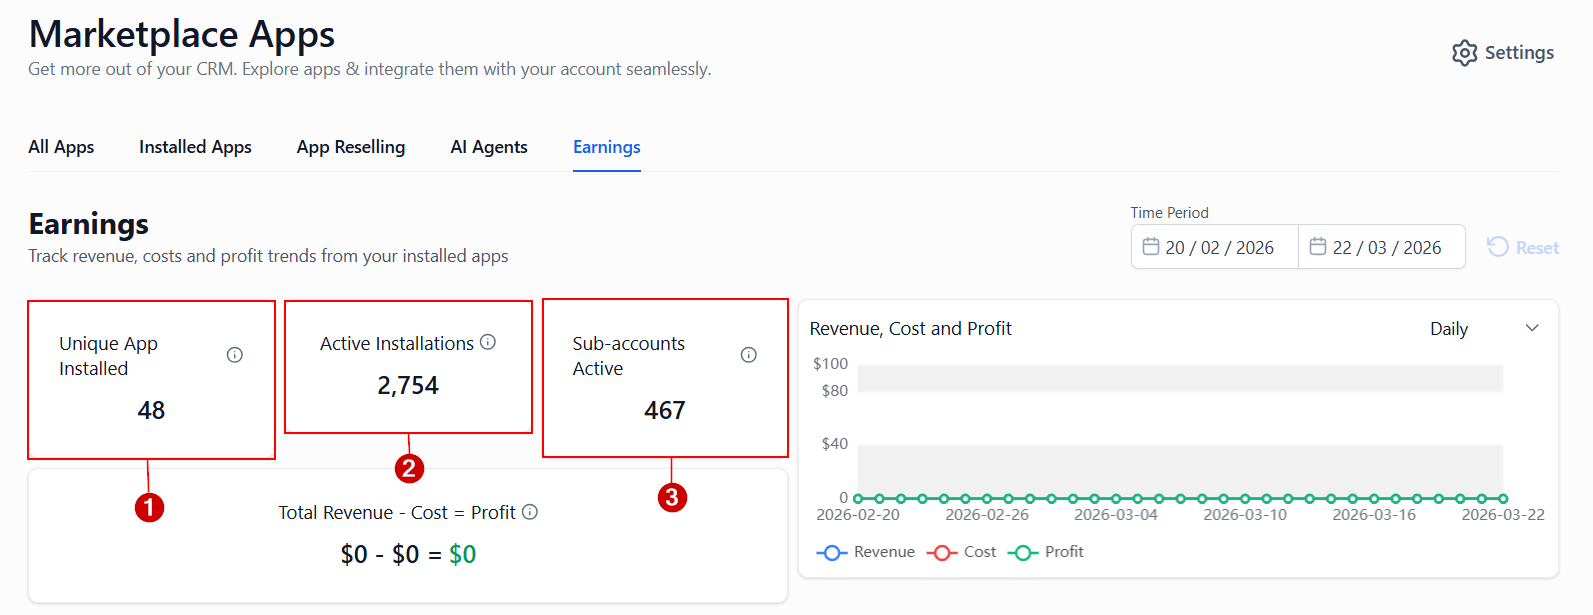
These metrics help you understand overall engagement and adoption across your client base.
Agency-Level Financial Visibility
The dashboard offers a comprehensive financial summary of your Marketplace activity, including:
- A breakdown of costs, profits, and revenue generated from apps
- Net profit (Revenue – Cost)
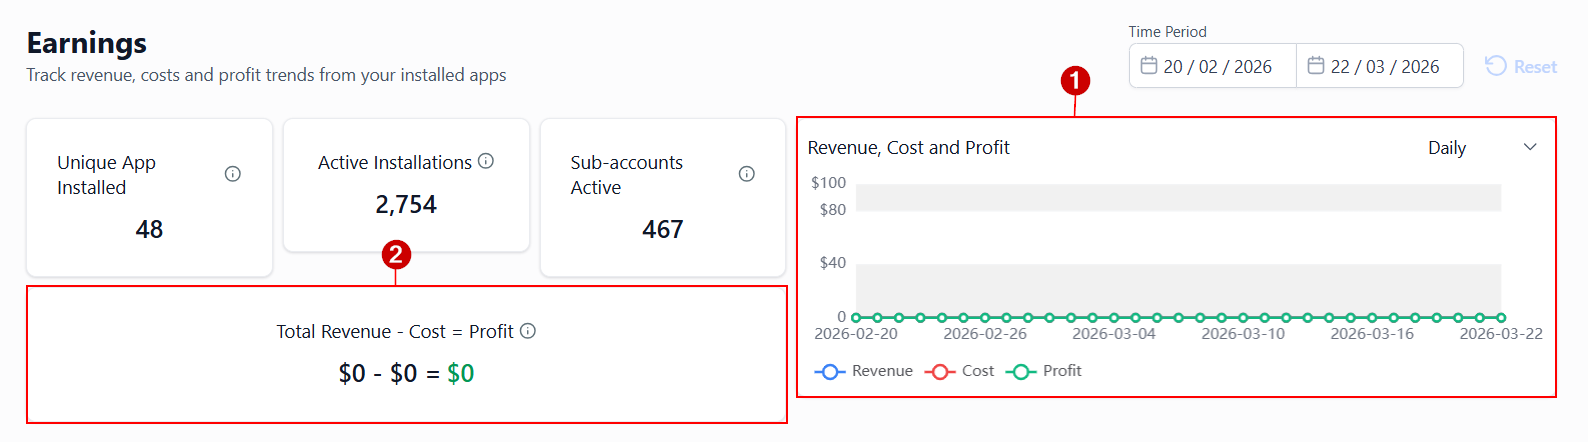
📌Note: The “Total Revenue – Cost” figure reflects the total revenue generated (from both agencies and sub-accounts) minus the cost paid to the developer. For agency apps, revenue and cost are equal. For sub-account apps where reselling is enabled, revenue may exceed cost, resulting in a profit margin. The sub-account breakdown provides additional visibility into revenue, cost, and profit at the client level.
App Analysis
The App Analysis tab provides a focused view of performance at the individual app level, helping you evaluate how each app contributes to your overall Marketplace activity. This section is especially useful for identifying high-performing apps, monitoring engagement, and spotting opportunities for optimization.
Within this tab, you’ll find the following metrics:
- App Name: The name of each app currently in use across your sub-accounts
- Total Install: The total number of times the app has been installed
- Active Sub-accounts: The number of sub-accounts actively using the app
- Churn Rate: The rate at which users uninstall the app
- Total Revenue: The total revenue generated by the app
- Total Cost: The total cost associated with the app
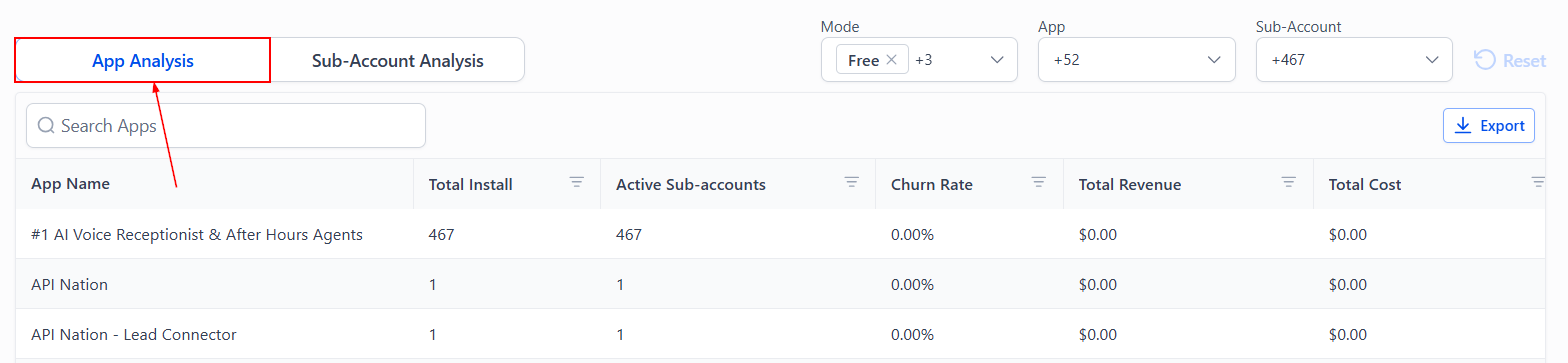
By reviewing these metrics together, you can better understand which apps are driving value, which may need attention, and how each app impacts your overall profitability. This insight supports more informed decisions around app selection, retention strategies, and client recommendations.
Sub-Account Revenue Breakdown
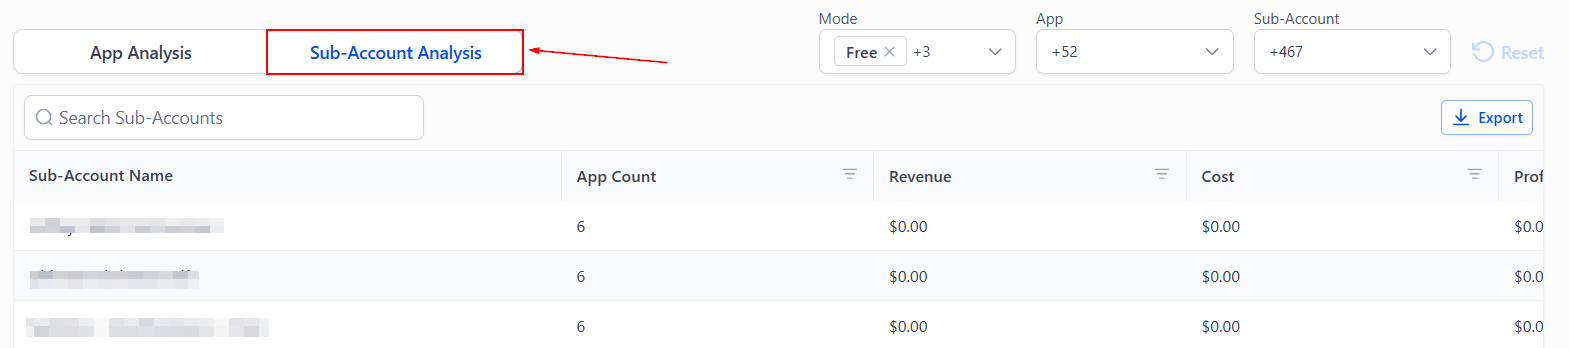
For a more detailed view, you can analyze performance at the sub-account level:
- View revenue contribution by individual sub-accounts
- Identify which clients generate the most or least value
- Analyze revenue distribution for specific apps or selected timeframes
This makes it easier to prioritize clients and refine your pricing, upselling, and app strategies.
Data Export
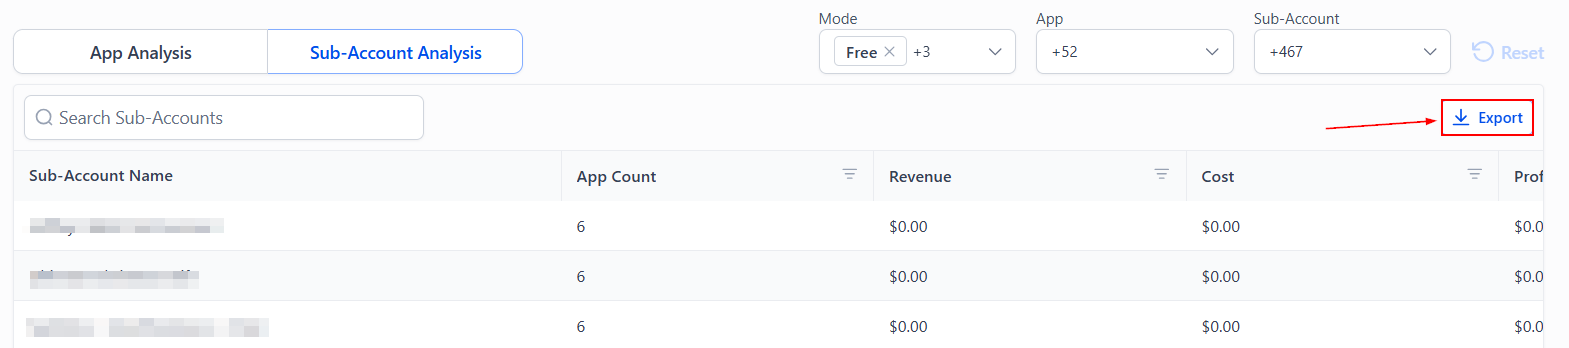
Export dashboard data for offline analysis or reporting. Exports reflect any filters applied, making it simple to share relevant insights with team members or stakeholders.
The Marketplace Earnings Dashboard simplifies how you track and evaluate app performance by consolidating essential metrics in one place. With greater visibility into revenue, costs, and client-level contributions, you can confidently refine your strategy and ensure your Marketplace activity aligns with your agency’s goals.