Ad Manager Statistics Overview
The Statistics tab within Ad Manager provides a comprehensive view of campaign performance through detailed analytics and conversion summaries. This feature allows for an in-depth understanding of key metrics across all campaigns. By leveraging filters such as date ranges and campaign pages, you can customize their analyses for enhanced insight and precision.
Campaign Statistics
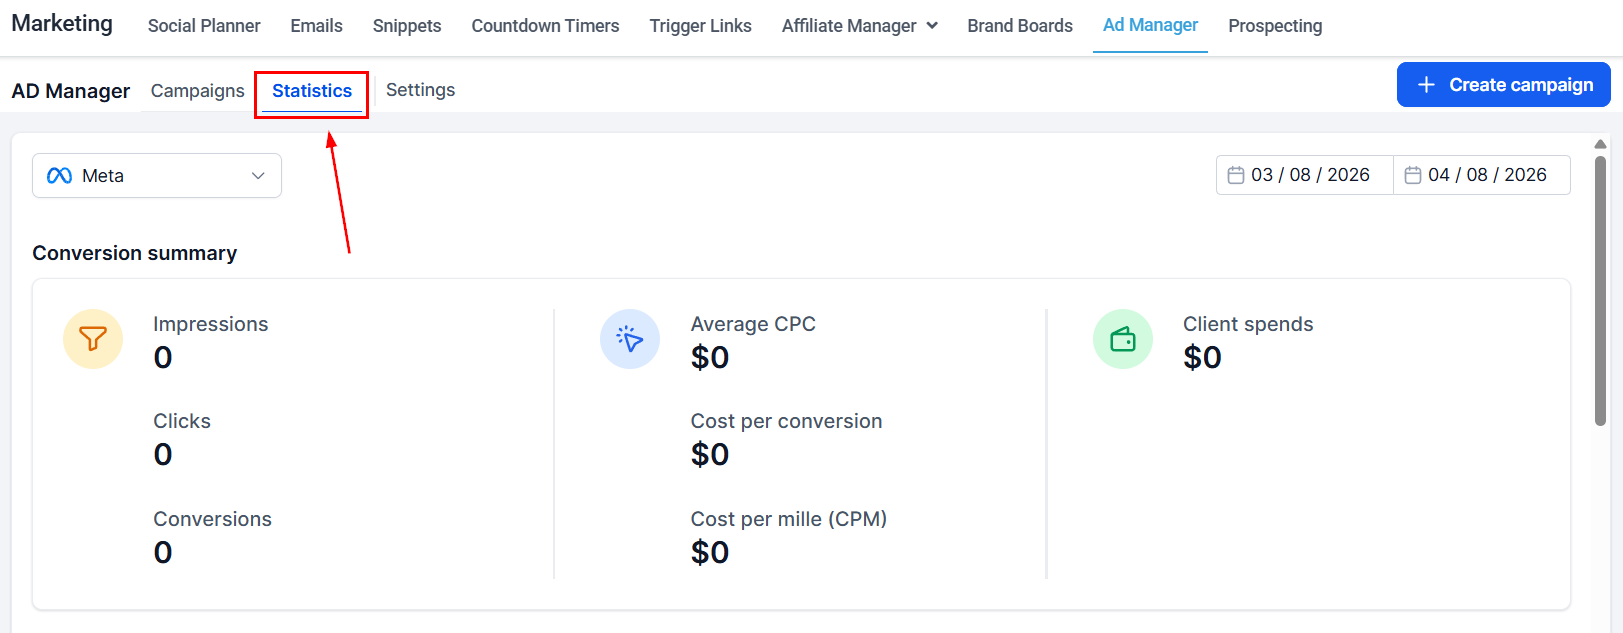
Access the Statistics tab from the Ad Manager home screen, located alongside the default Campaigns tab.
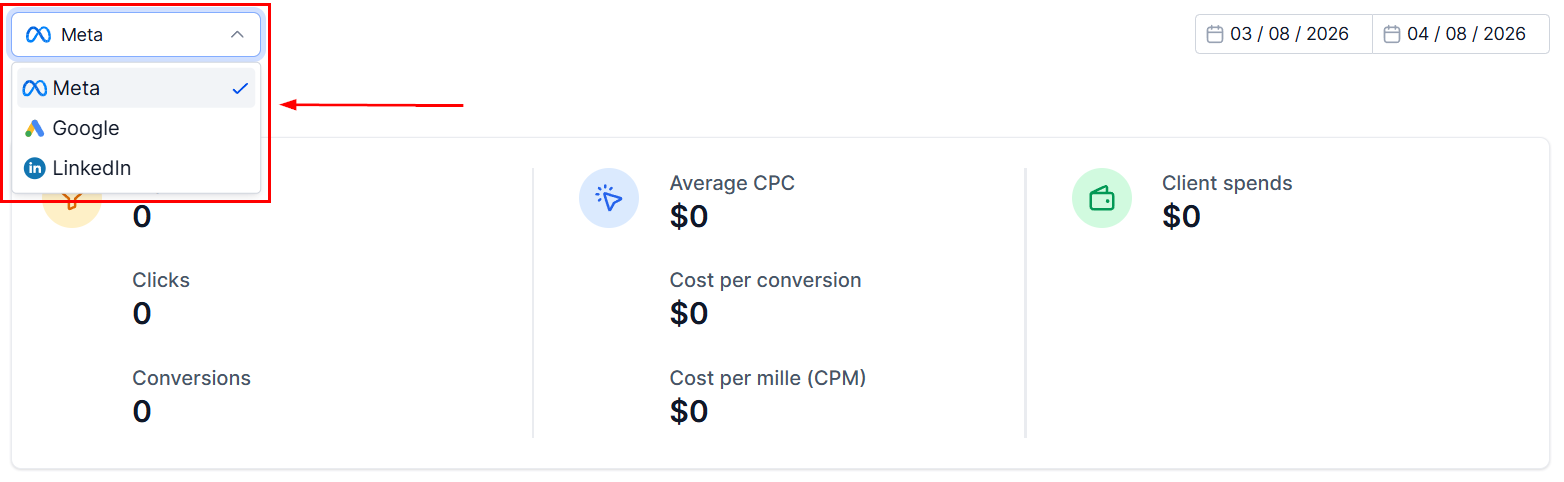
Channels
Choose whether to view statistics for Facebook or Google Ad campaigns from the channel selector.
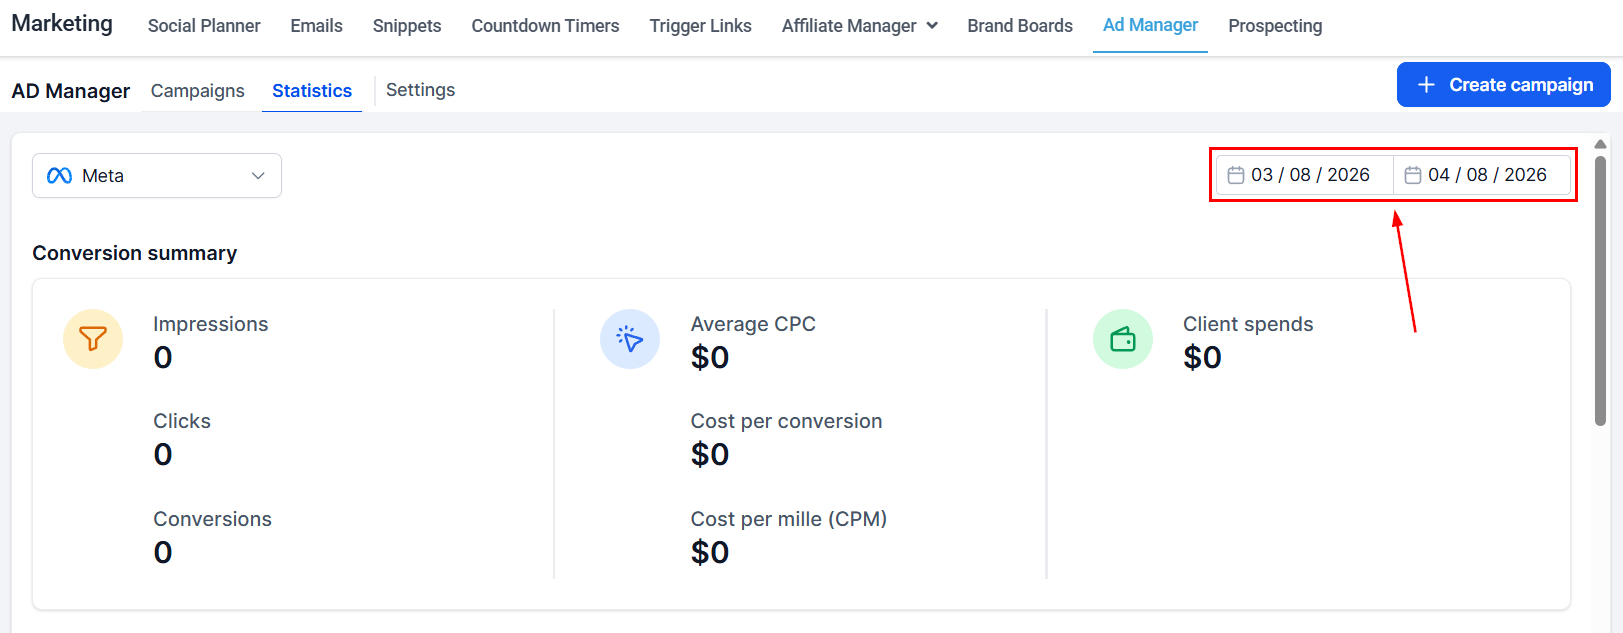
Date Range
Use the date range filter to focus on specific periods and analyze performance within that range.
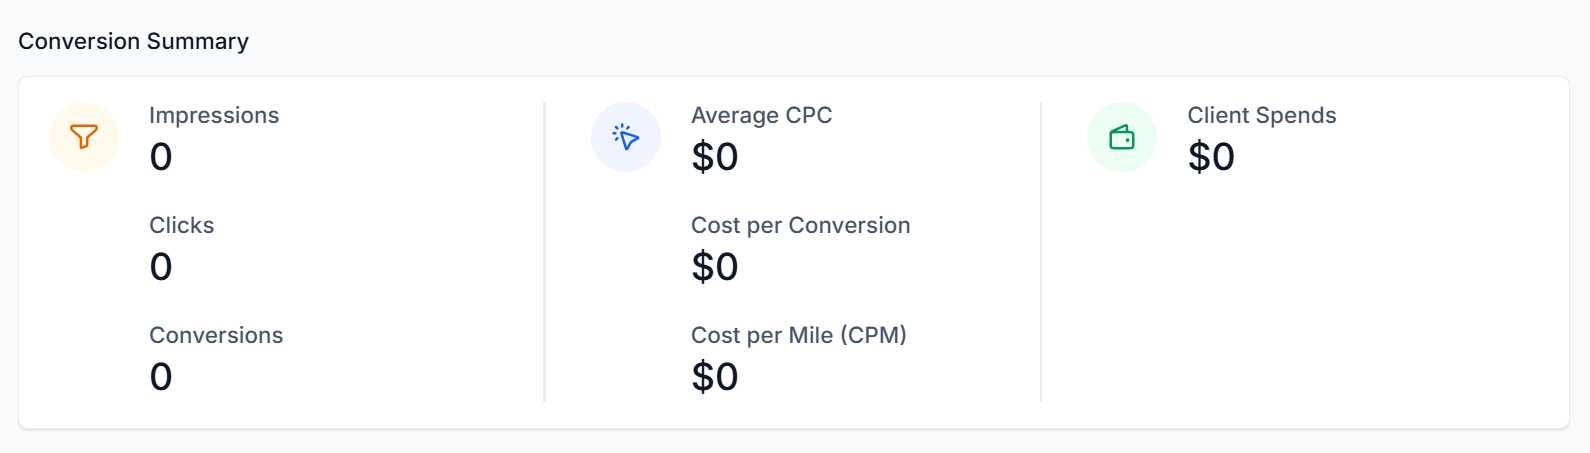
Conversion Summary
View a tabular representation of key metrics for all published and paused campaigns, such as clicks, Conversions, Cost Per Conversion, and Impressions.
Performance Analytics
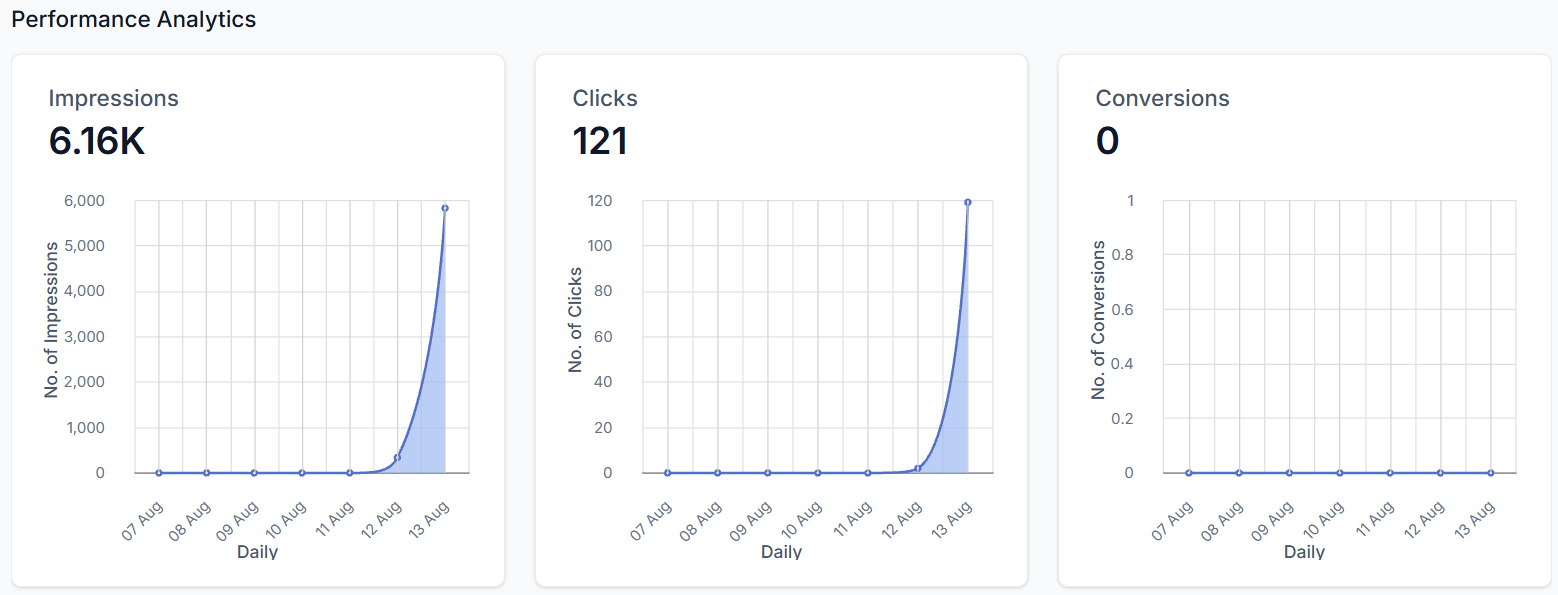
This section contains graphs for your impressions, clicks, and conversions of your ad campaign.
Campaign Details
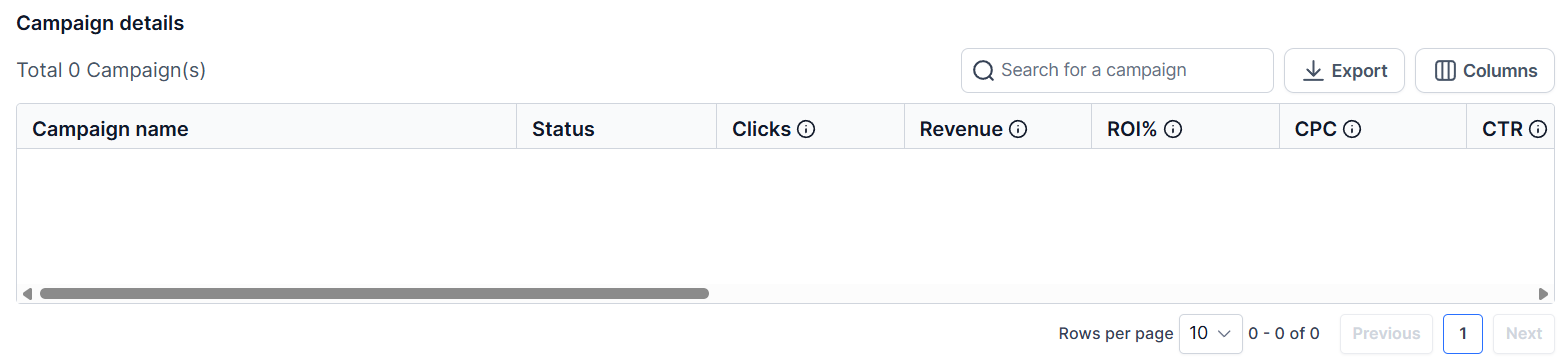
Utilize the Campaign Details table to assess key details about your campaign.
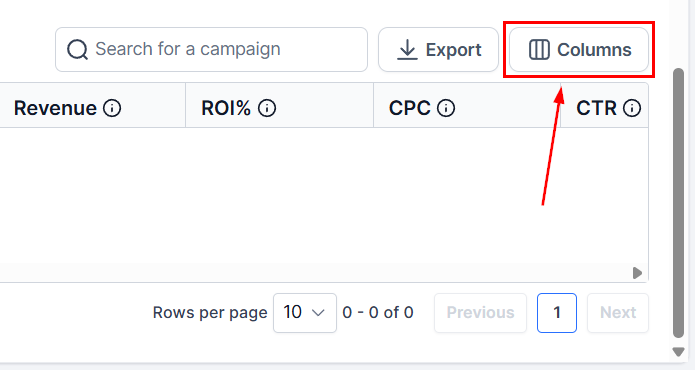
Click the Columns button to add or remove columns for targeted analysis.
The available columns are:
- Campaign Name: The title or identifier for your ad campaign inside the CRM.
- Campaign ID: This will show the Meta or Google Ad ID for easier identification.
- Status: Indicates the current state of the campaign (e.g., Active, or Paused).
- Clicks: Represents the total number of user interactions with your ad. This metric serves as a key indicator of audience interest in your offer.
- Revenue: The total income attributed to the campaign, measured through sales or conversions generated by the ad.
- ROI (Return on Investment): A percentage that quantifies the profitability of your campaign by comparing the revenue generated to the advertising spend.
- CPC (Cost Per Click): The average cost incurred for each user click on your ad, reflecting the efficiency of your campaign spending.
- CTR (Click-Through Rate): The proportion of users who clicked on your ad after viewing it, expressed as a percentage. This metric highlights the ad’s effectiveness in capturing audience attention.
- Sales: The total number of purchases generated by the ad campaign.
- CPS (Cost Per Sale): The average expenditure required to generate a sale, calculated by dividing the total ad spend by the number of sales achieved.
- Leads: The number of potential customers who have expressed interest in your product or service, often by providing their contact information.
- Results: The total occurrences of your ad achieving its designated objective, based on the goal selected during campaign setup.
- CPL (Cost Per Lead): The average cost to acquire a lead, calculated by dividing the total ad spend by the number of leads generated.
- Impressions: The total number of times your ad was displayed to users, regardless of whether they interacted with it.
- Spend: The total monetary investment in the ad campaign, encompassing all associated costs.
- Reach: Displays the number of unique users who saw your ad at least once.
- Frequency: Indicates how often your ad was shown to each unique user (calculated as Impressions/Reach).
Individual Campaign Statistics
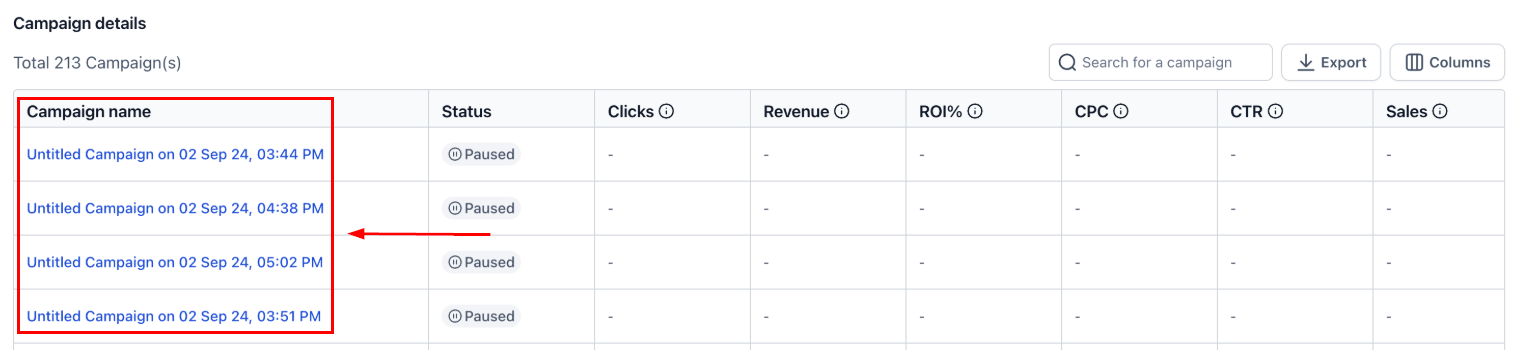
Click on the name of a specific campaign to view its individual performance metrics on a new page.
Quick Actions
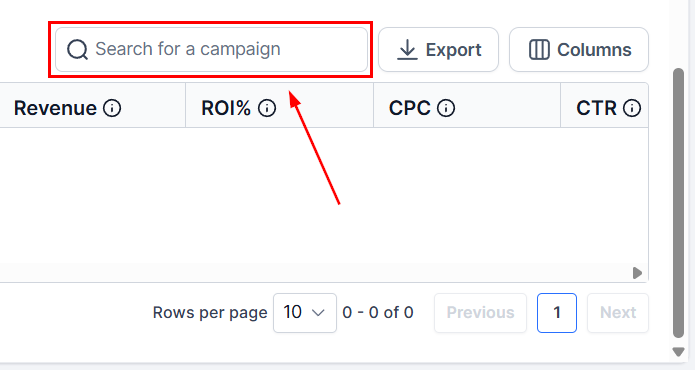
Search
Locate a specific campaign by entering the campaign name in this field.
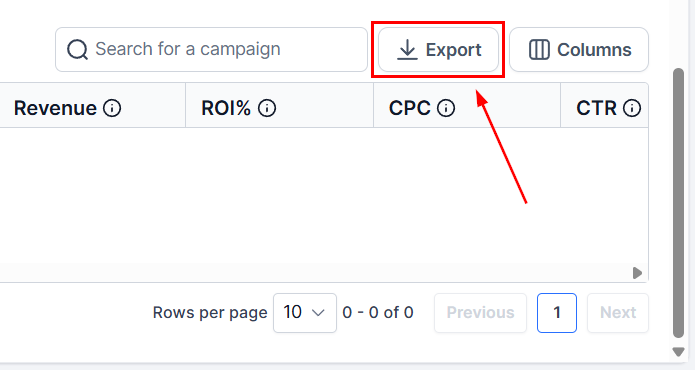
Export
Download a CSV file containing the data collected within the selected timeframe, enabling offline analysis and record-keeping.
Why It Matters
- Effective Campaign Monitoring: The ability to evaluate metrics such as impressions, clicks, and conversions empowers advertisers to assess campaign performance and identify areas for optimization.
- Enhanced Ad Manager Value: The Statistics tab enables you to measure and optimize your campaigns for greater return on investment.
And there you have it. Use your new knowledge to take advantage of the Ad Manager Statistics, drive better advertising outcomes, and achieve your marketing goals.
Not a Funnelbud customer yet?
Try our all-in-one CRM for sales and marketing — free for 7 days, no commitment.