How to Add Attribution & UTM Parameters as Filters for Contact and Opportunity Widgets
The Attribution Parameters feature within Contacts and Opportunity Widgets empowers users to gain comprehensive insights into the origins and behaviors of their contacts and opportunities. By leveraging this advanced functionality, users can filter data based on First or Last attribution, utilize critical UTM parameters, and design detailed, custom widgets. This feature offers enhanced flexibility and control over data visualization and reporting, significantly improving the ability to track and optimize contact and opportunity sources with precision.
Attribution Filters in Custom Widgets
To create custom widgets with attribution filters, follow these steps:
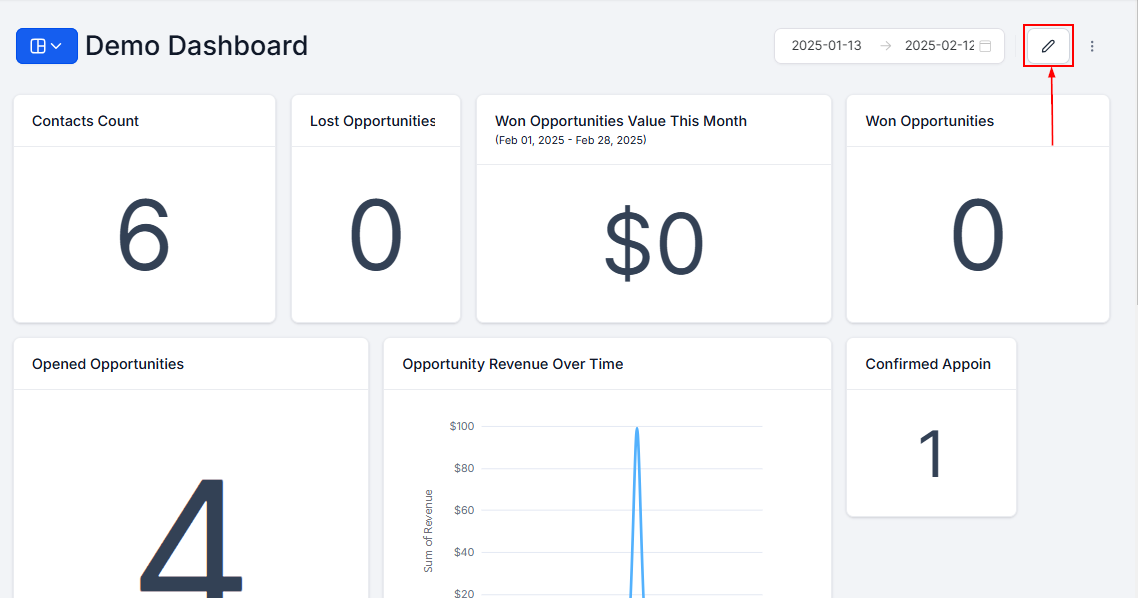
Edit Dashboard
Click on the edit icon on your dashboard to begin customizing your widgets.
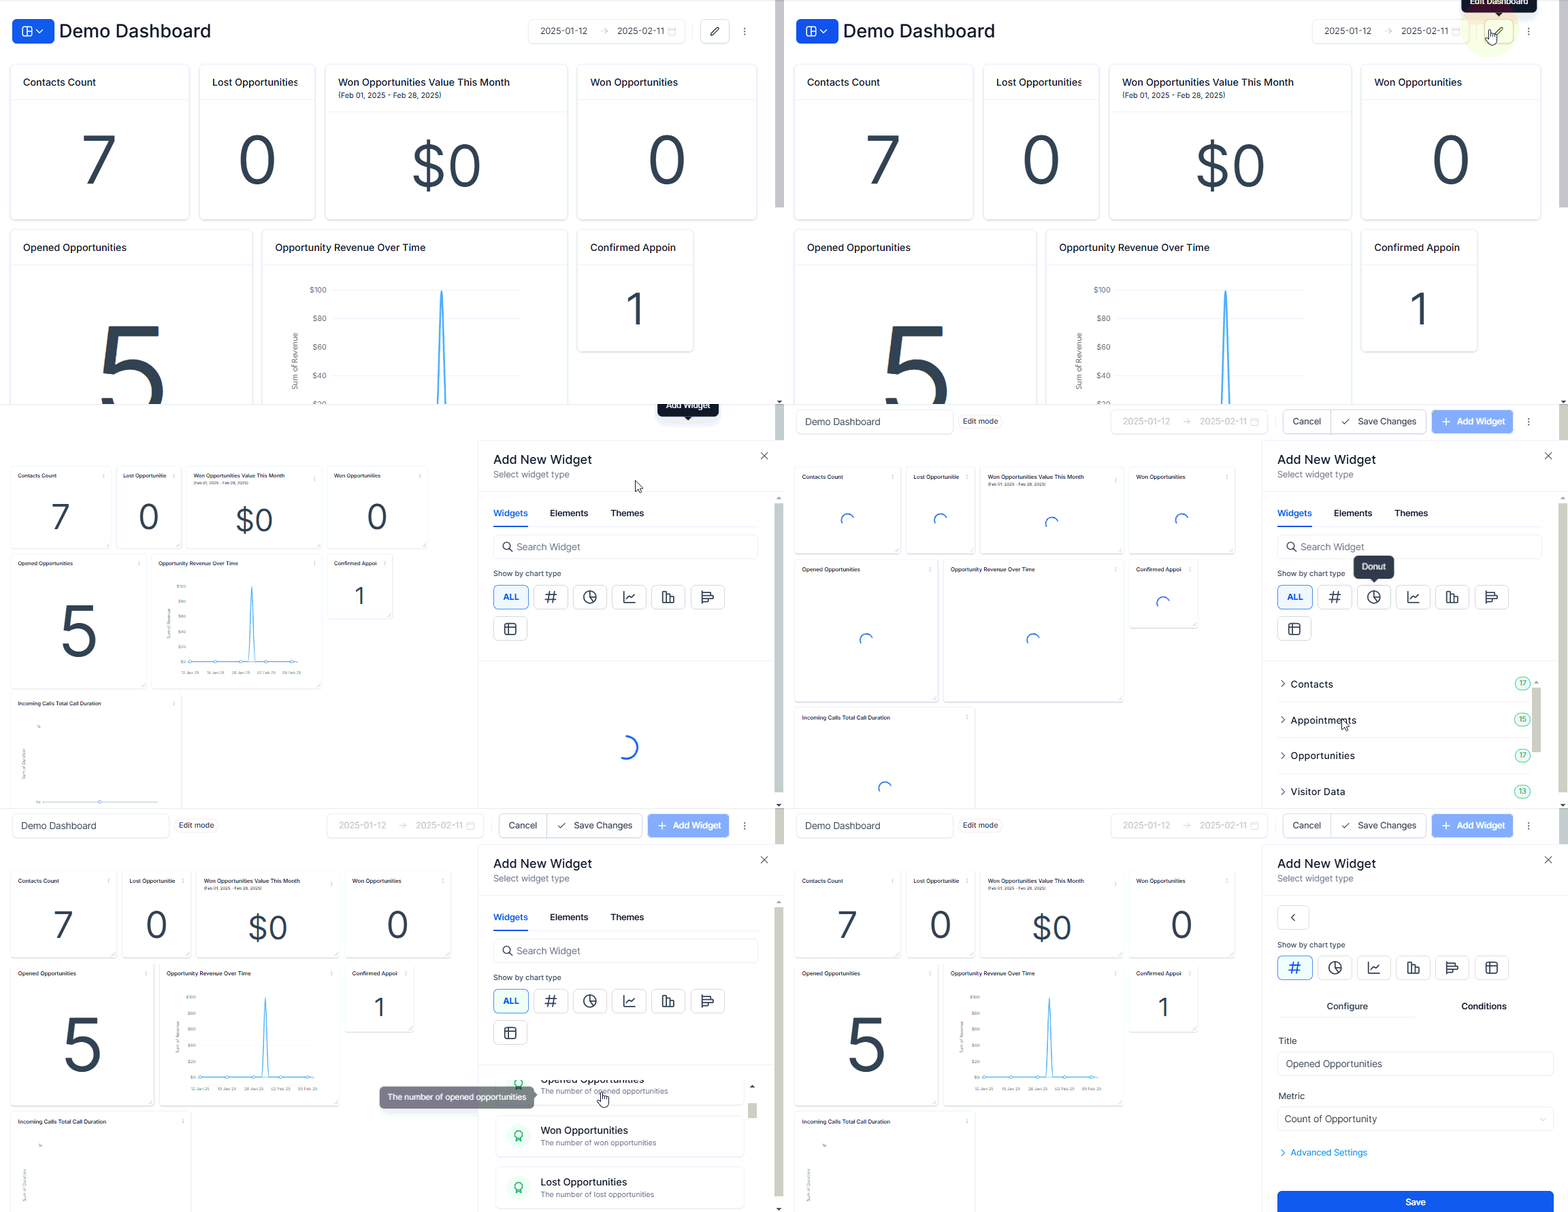
Add Widget
Click on “Add widget” and select a widget under the Contact or Opportunity category. In this guide, we will use the Opened Opportunities widget.
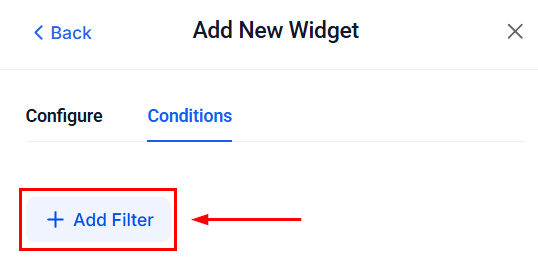
Add Attribution Condition
Switch to the condition tab and click on “Add Filter.”
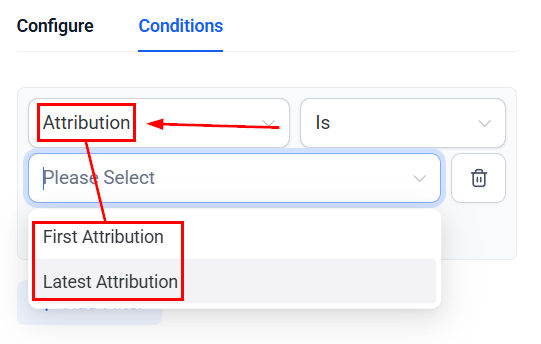
From the dropdown, choose “Attribution” and decide whether to filter based on First or Latest Attribution.
Add Attribution/UTM Fields
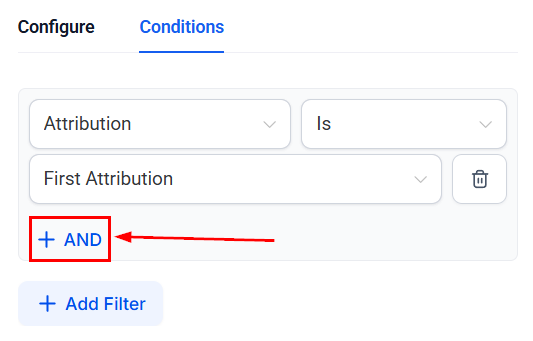
After selecting the attribution type, click ”+ AND” and choose the desired property from the dropdown.
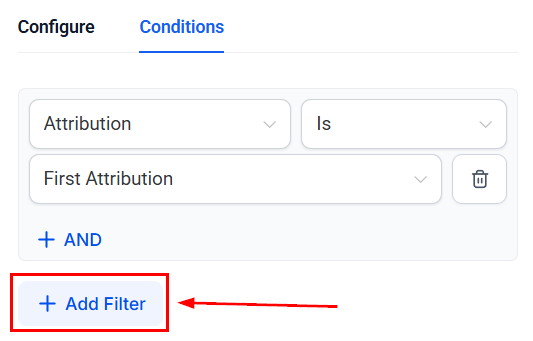
You can add more attribution fields by clicking “+ Add Filter.”
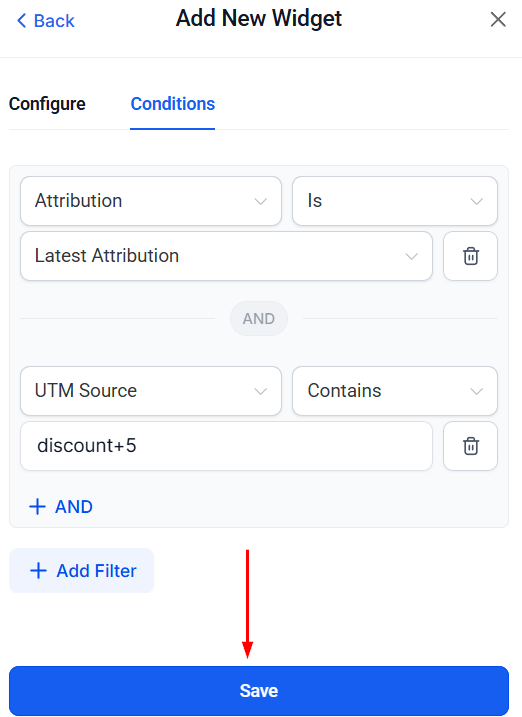
Save the Widget
Save your widget to finalize the customization once all the necessary fields and conditions are added.
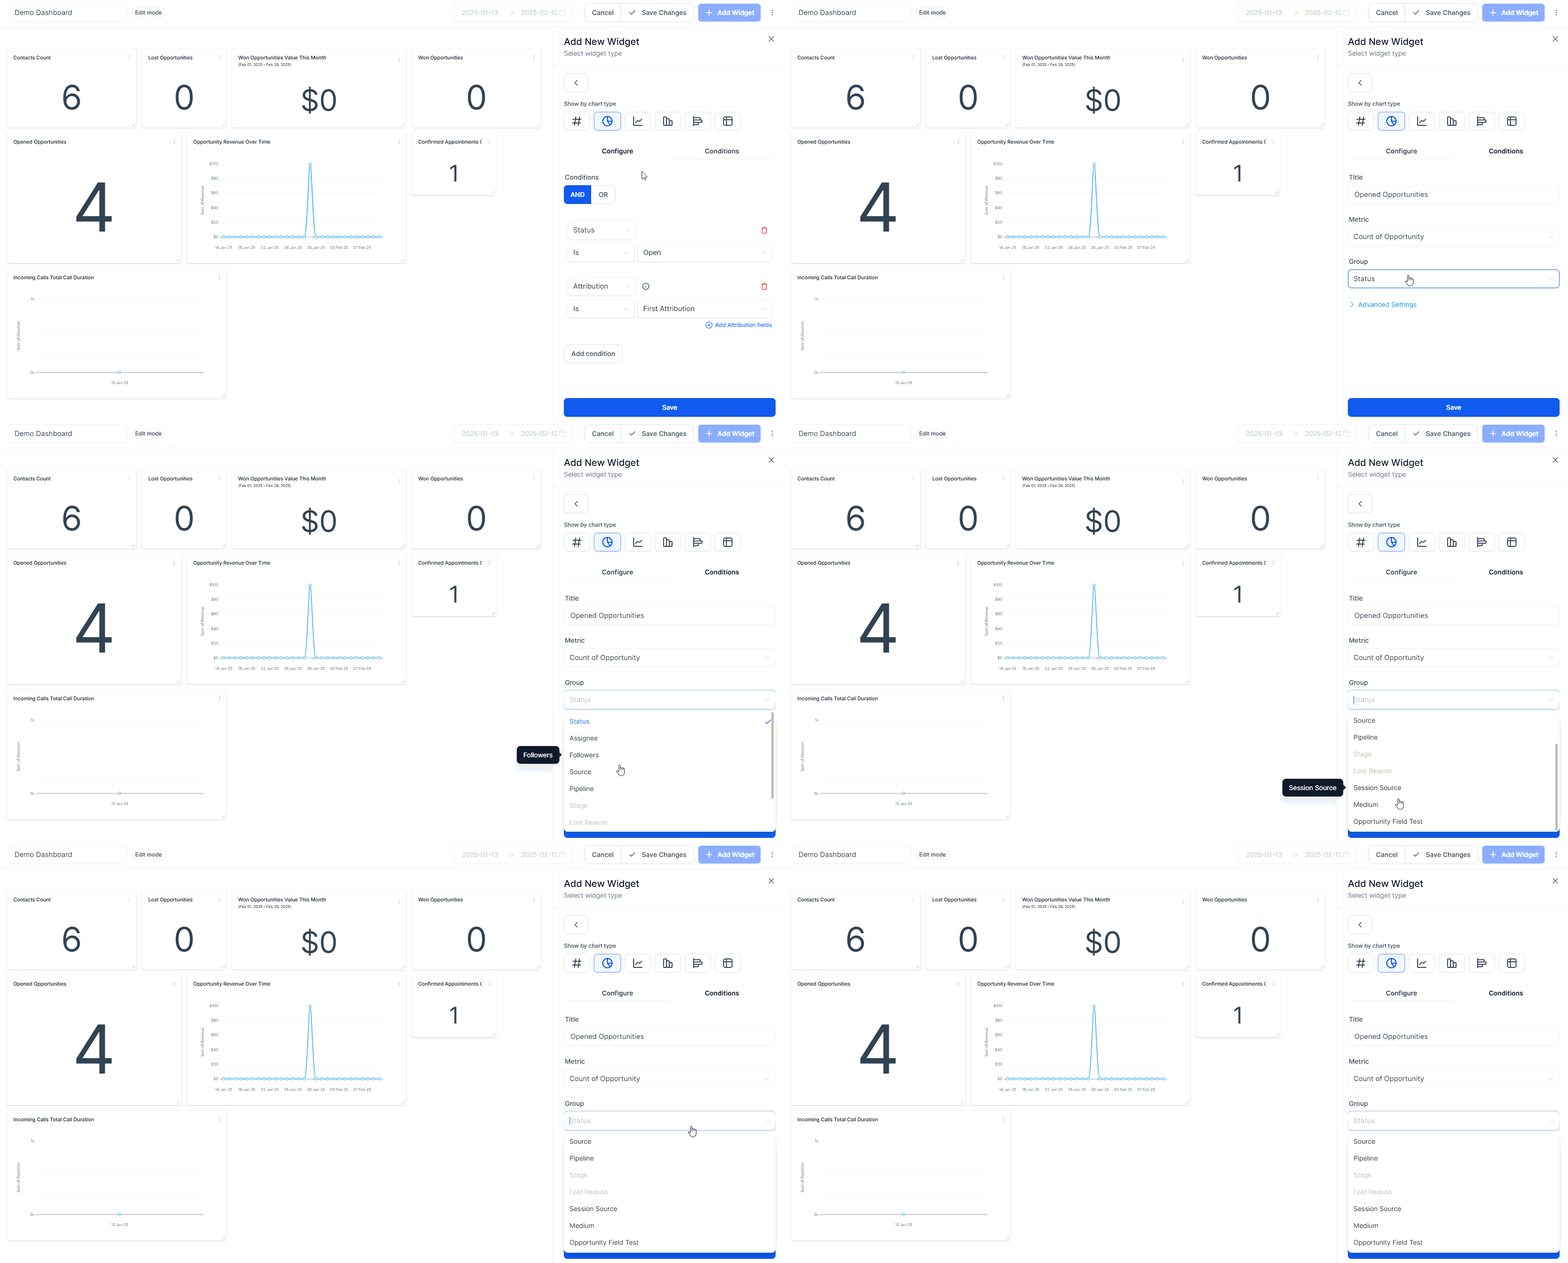
Grouping Donut Charts with Session Source or Medium
To group data using Donut or Line graphs, follow these steps:
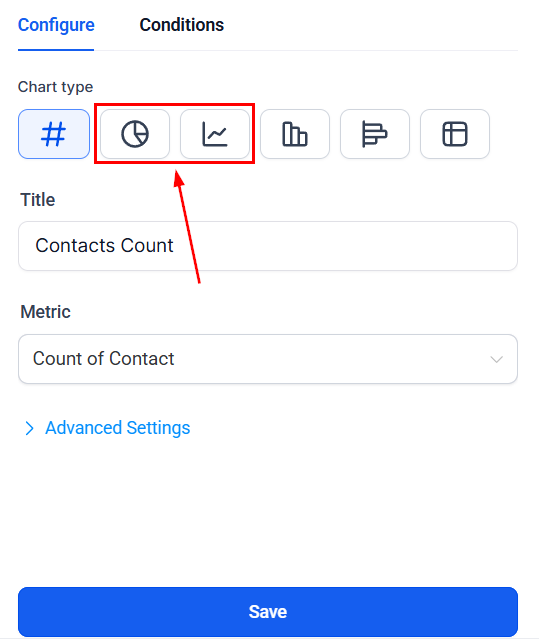
Choose a Donut or Line Graph
Select either the Donut or Line Graph option in the chart selector bar.
Update the Group/View By Property
Switch to the configuration tab and choose properties like Session Source or Medium from the Group/View By dropdown.
Adding Attribution Fields and UTM Parameters as Table Chart Columns
To enhance table charts with attribution fields and UTM parameters, follow these steps:
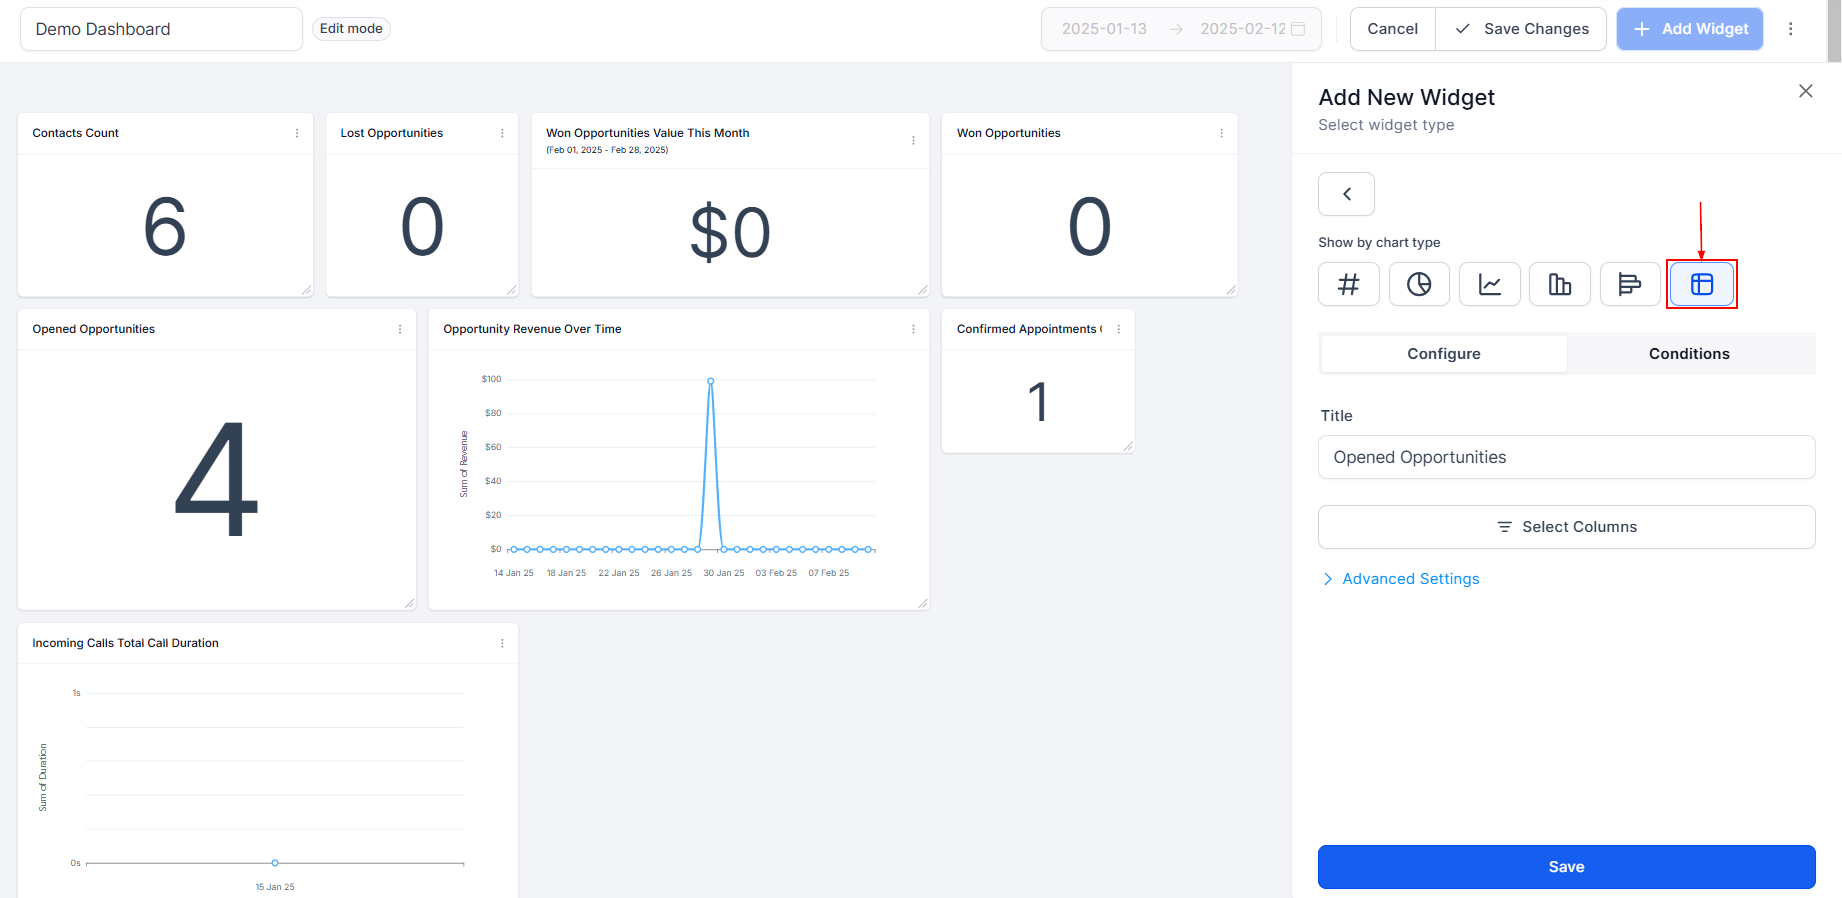
Choose Table Chart
Opt for the Table Chart in the chart selector bar.
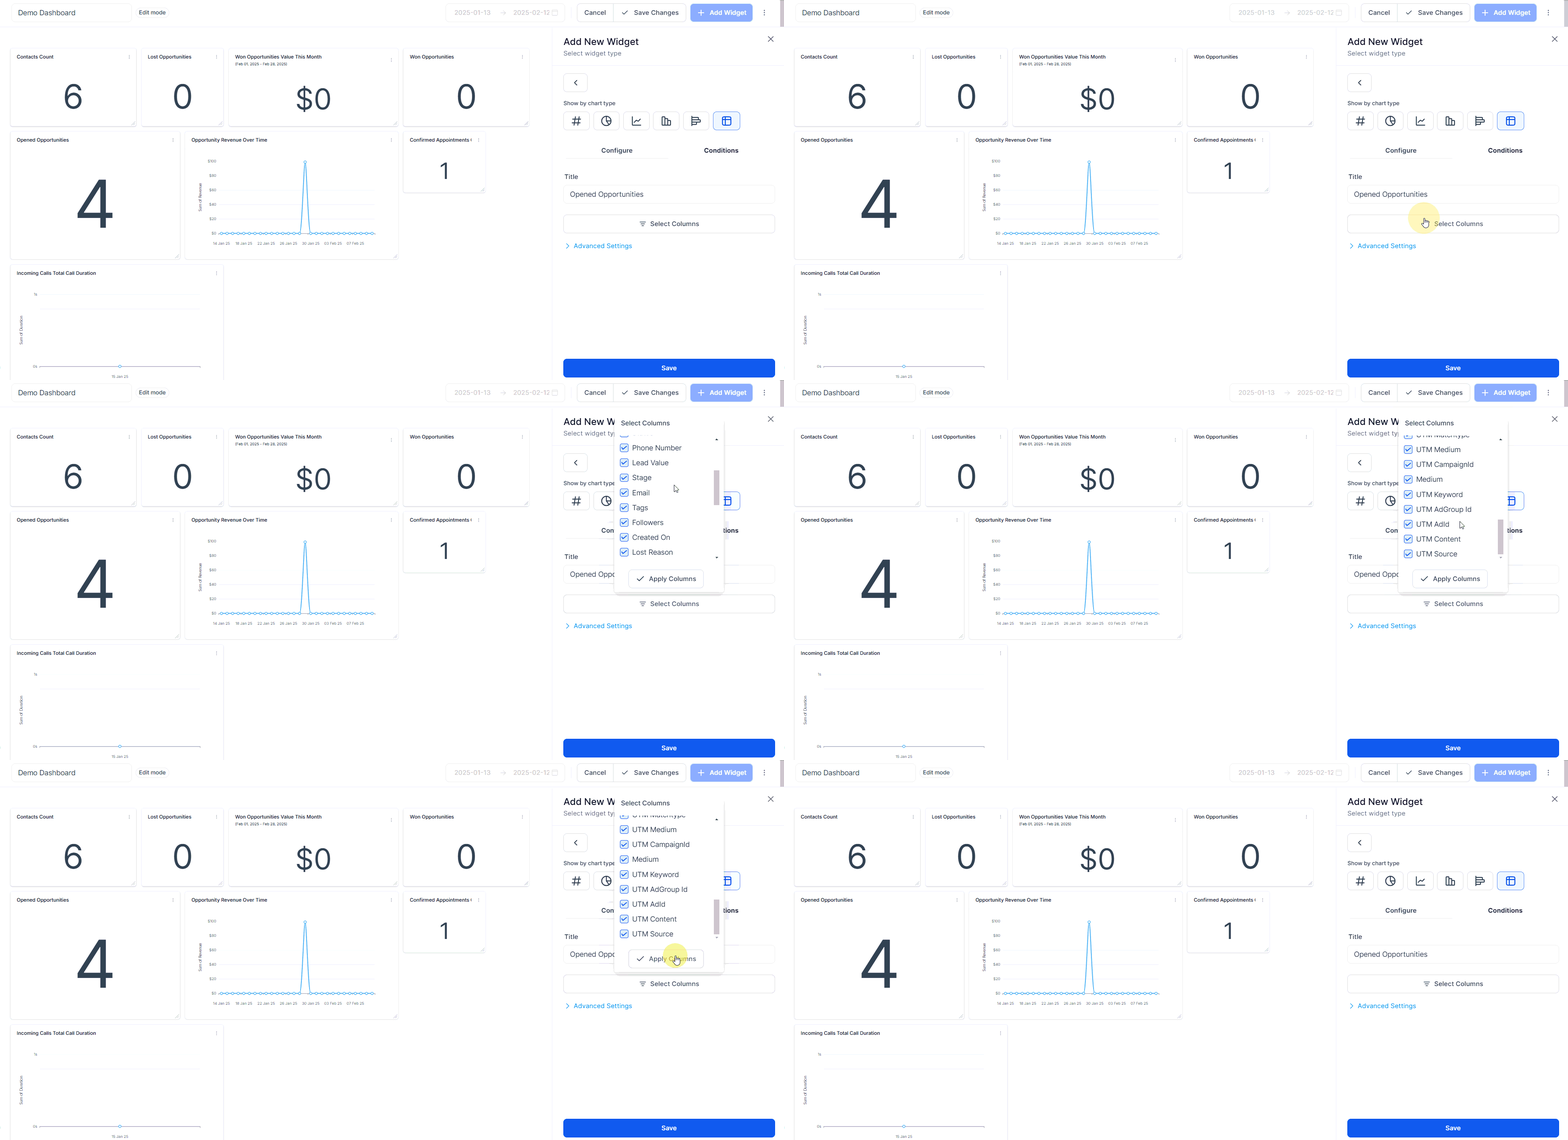
Select Columns
Click “Select Columns” and choose the desired columns for your Table chart.
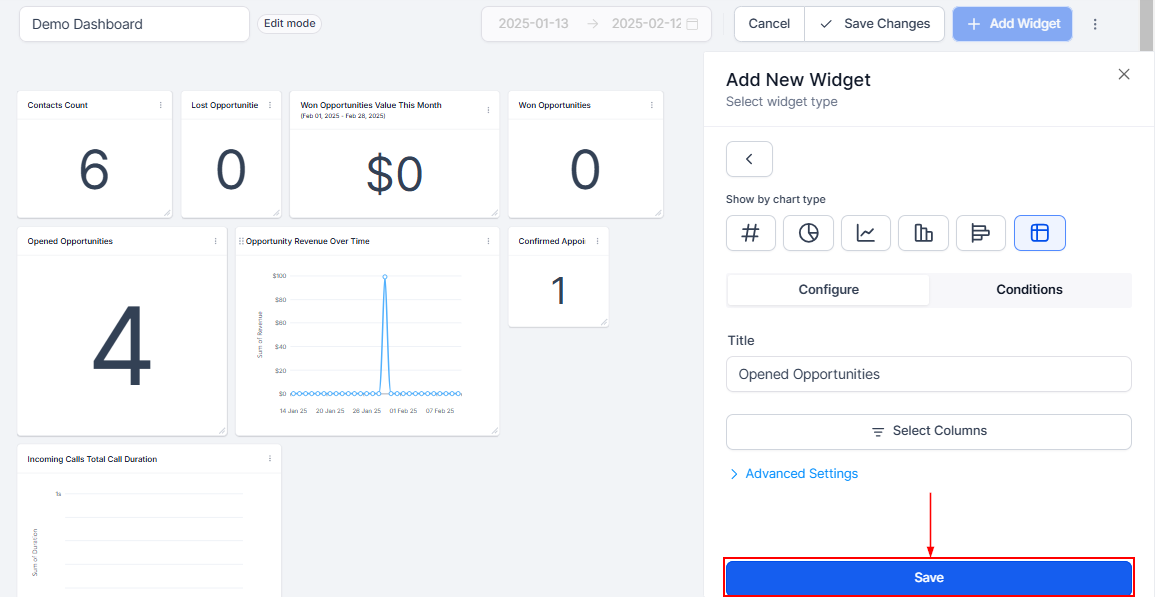
Save
Once you’ve selected the necessary columns, save your widget.
By utilizing custom widgets, donut charts, table charts, and comprehensive reporting features, you can gain deeper insights and control over your data visualization and reporting, ultimately driving more informed decision-making in your marketing strategies.
Important Notes
- UTM parameters and fields will only be visible on the Table and Granular insights view if the Attribution type (First or Latest) is added in widget conditions.
- Group/View by properties—Session Source and Medium—can only be selected if the Attribution type (First or Latest) is added to widget conditions.
Troubleshooting Tips
Widget Not Displaying Correctly
- Ensure that you have correctly added attribution conditions and fields.
Data Not Grouping as Expected
- Verify that the correct Group/View By properties are selected in the configuration tab.
Missing UTM Parameters
- Double-check that you have included an Attribution type in the widget conditions.
Frequently Asked Questions
Q: What are UTM parameters?
- UTM parameters are tags added to a URL to track the effectiveness of online marketing campaigns across traffic sources.
Q: How do First and Last Attributions differ?
- First Attribution tracks the first interaction a user has with your content, while the Last Attribution tracks the most recent interaction before conversion.
Q: Can I export the data from these widgets?
- Yes, you can export the data from these widgets as CSV files for further analysis.
Q: Why are some UTM parameters not visible?
- UTM parameters and fields will only be visible if the widget conditions include the Attribution type (First or Latest).
Not a Funnelbud customer yet?
Try our all-in-one CRM for sales and marketing — free for 7 days, no commitment.