SLA Performance Dashboard
The SLA Performance Dashboard brings together key metrics related to response times and SLA adherence. Instead of relying on scattered data points, you can view performance across messages, users, and communication channels in one place. This makes it easier to assess how often SLAs are being met, where breaches occur, and how response behavior evolves over time.
Key Insights Available
The dashboard provides several layers of insight to support performance analysis:
- SLA adherence tracking: View how many messages meet or breach defined SLAs
- Response time analysis: Monitor average response times across selected periods
- Trend monitoring: Identify patterns and changes in performance over time
- User-level performance: Evaluate how individual team members are handling conversations
- Channel-level breakdown: Compare performance across different communication channels
These insights help teams move from guesswork to data-driven decision-making when improving response workflows.
How to Use the Dashboard
Accessing and navigating the dashboard is straightforward:
Go to Conversations → Analytics → SLA Performance.
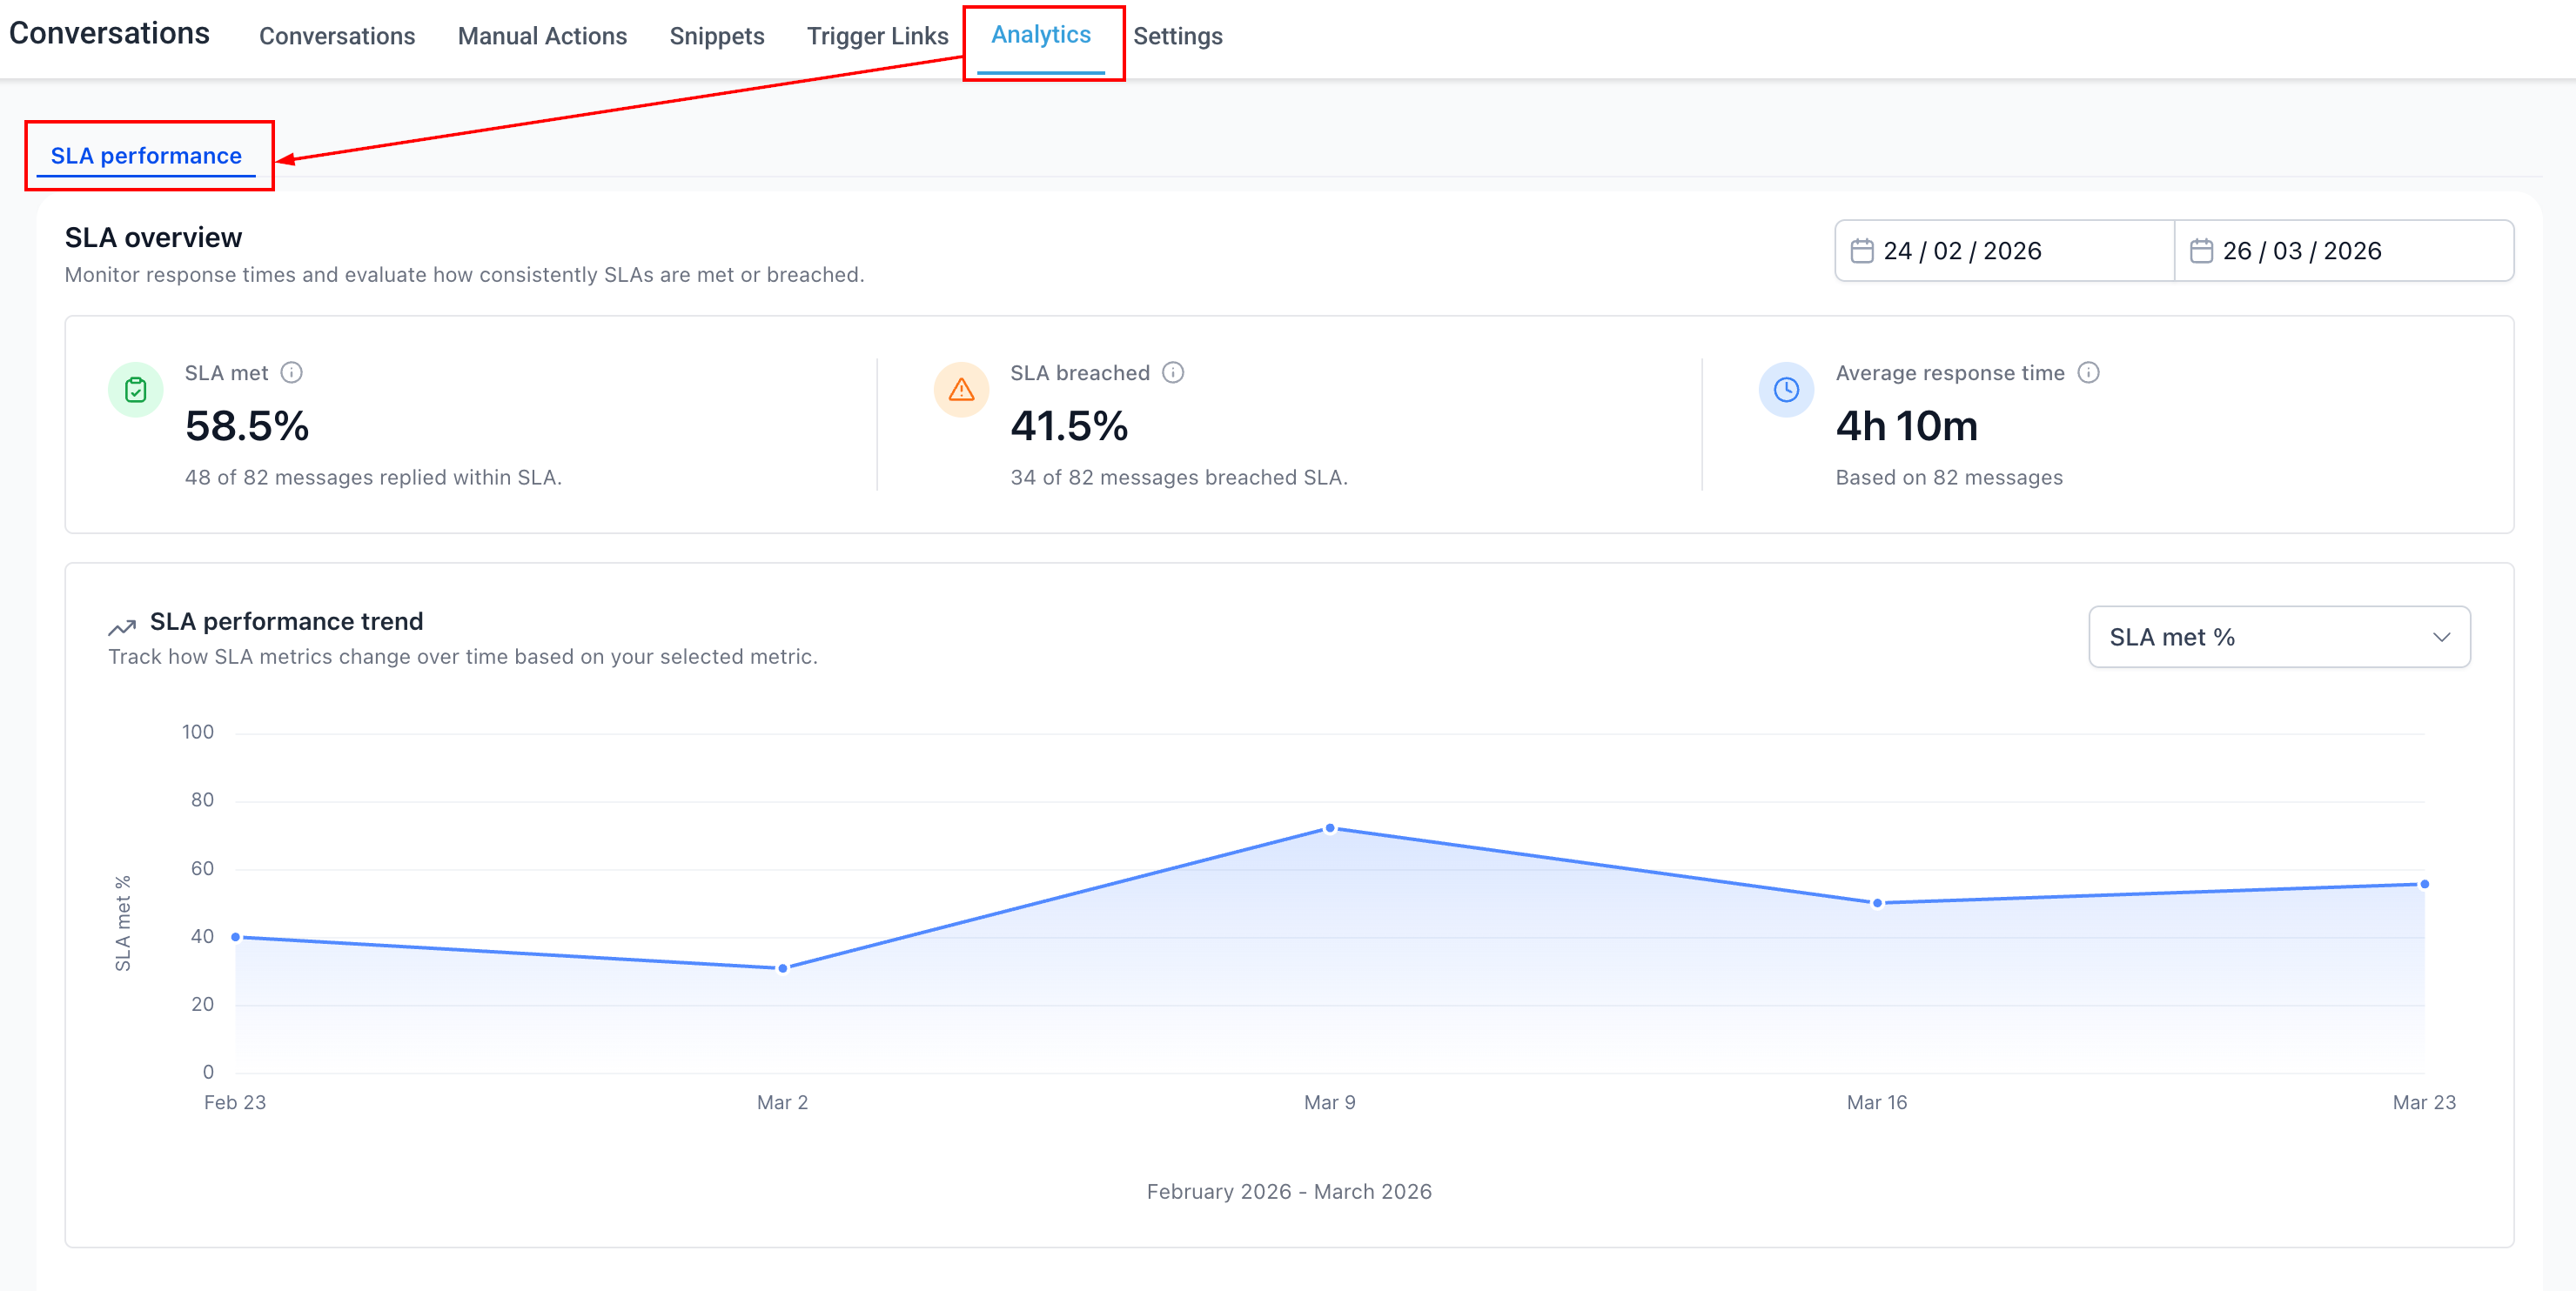
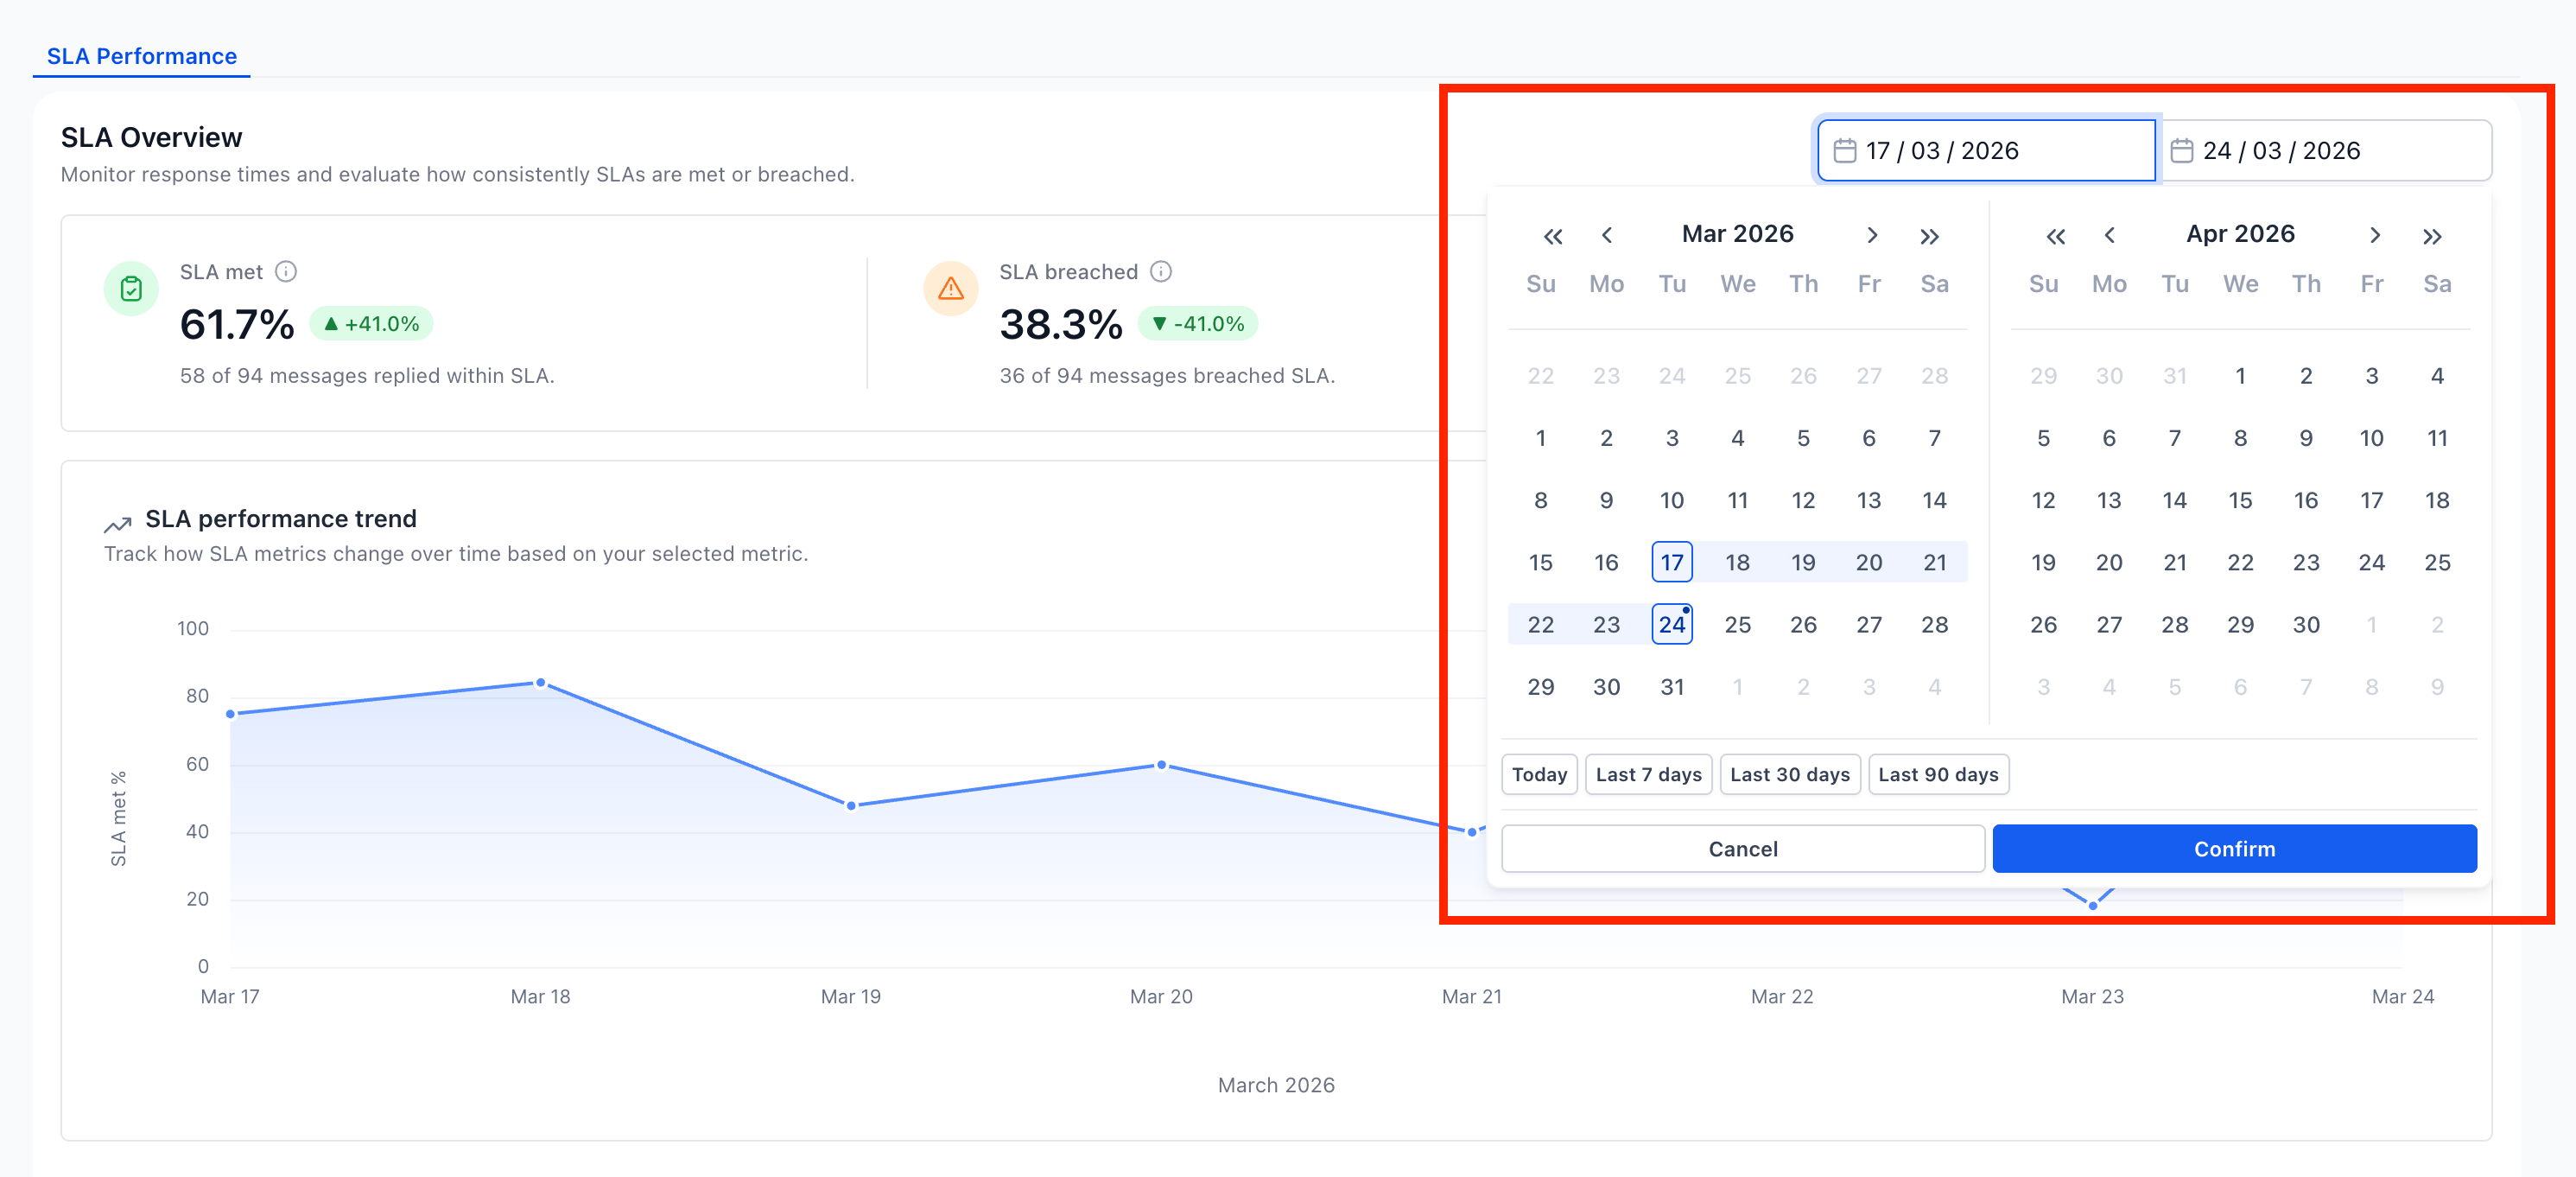
Select your desired time range using the available date filters.
📌Note: Data for the dashboard is available starting March 23, 2026
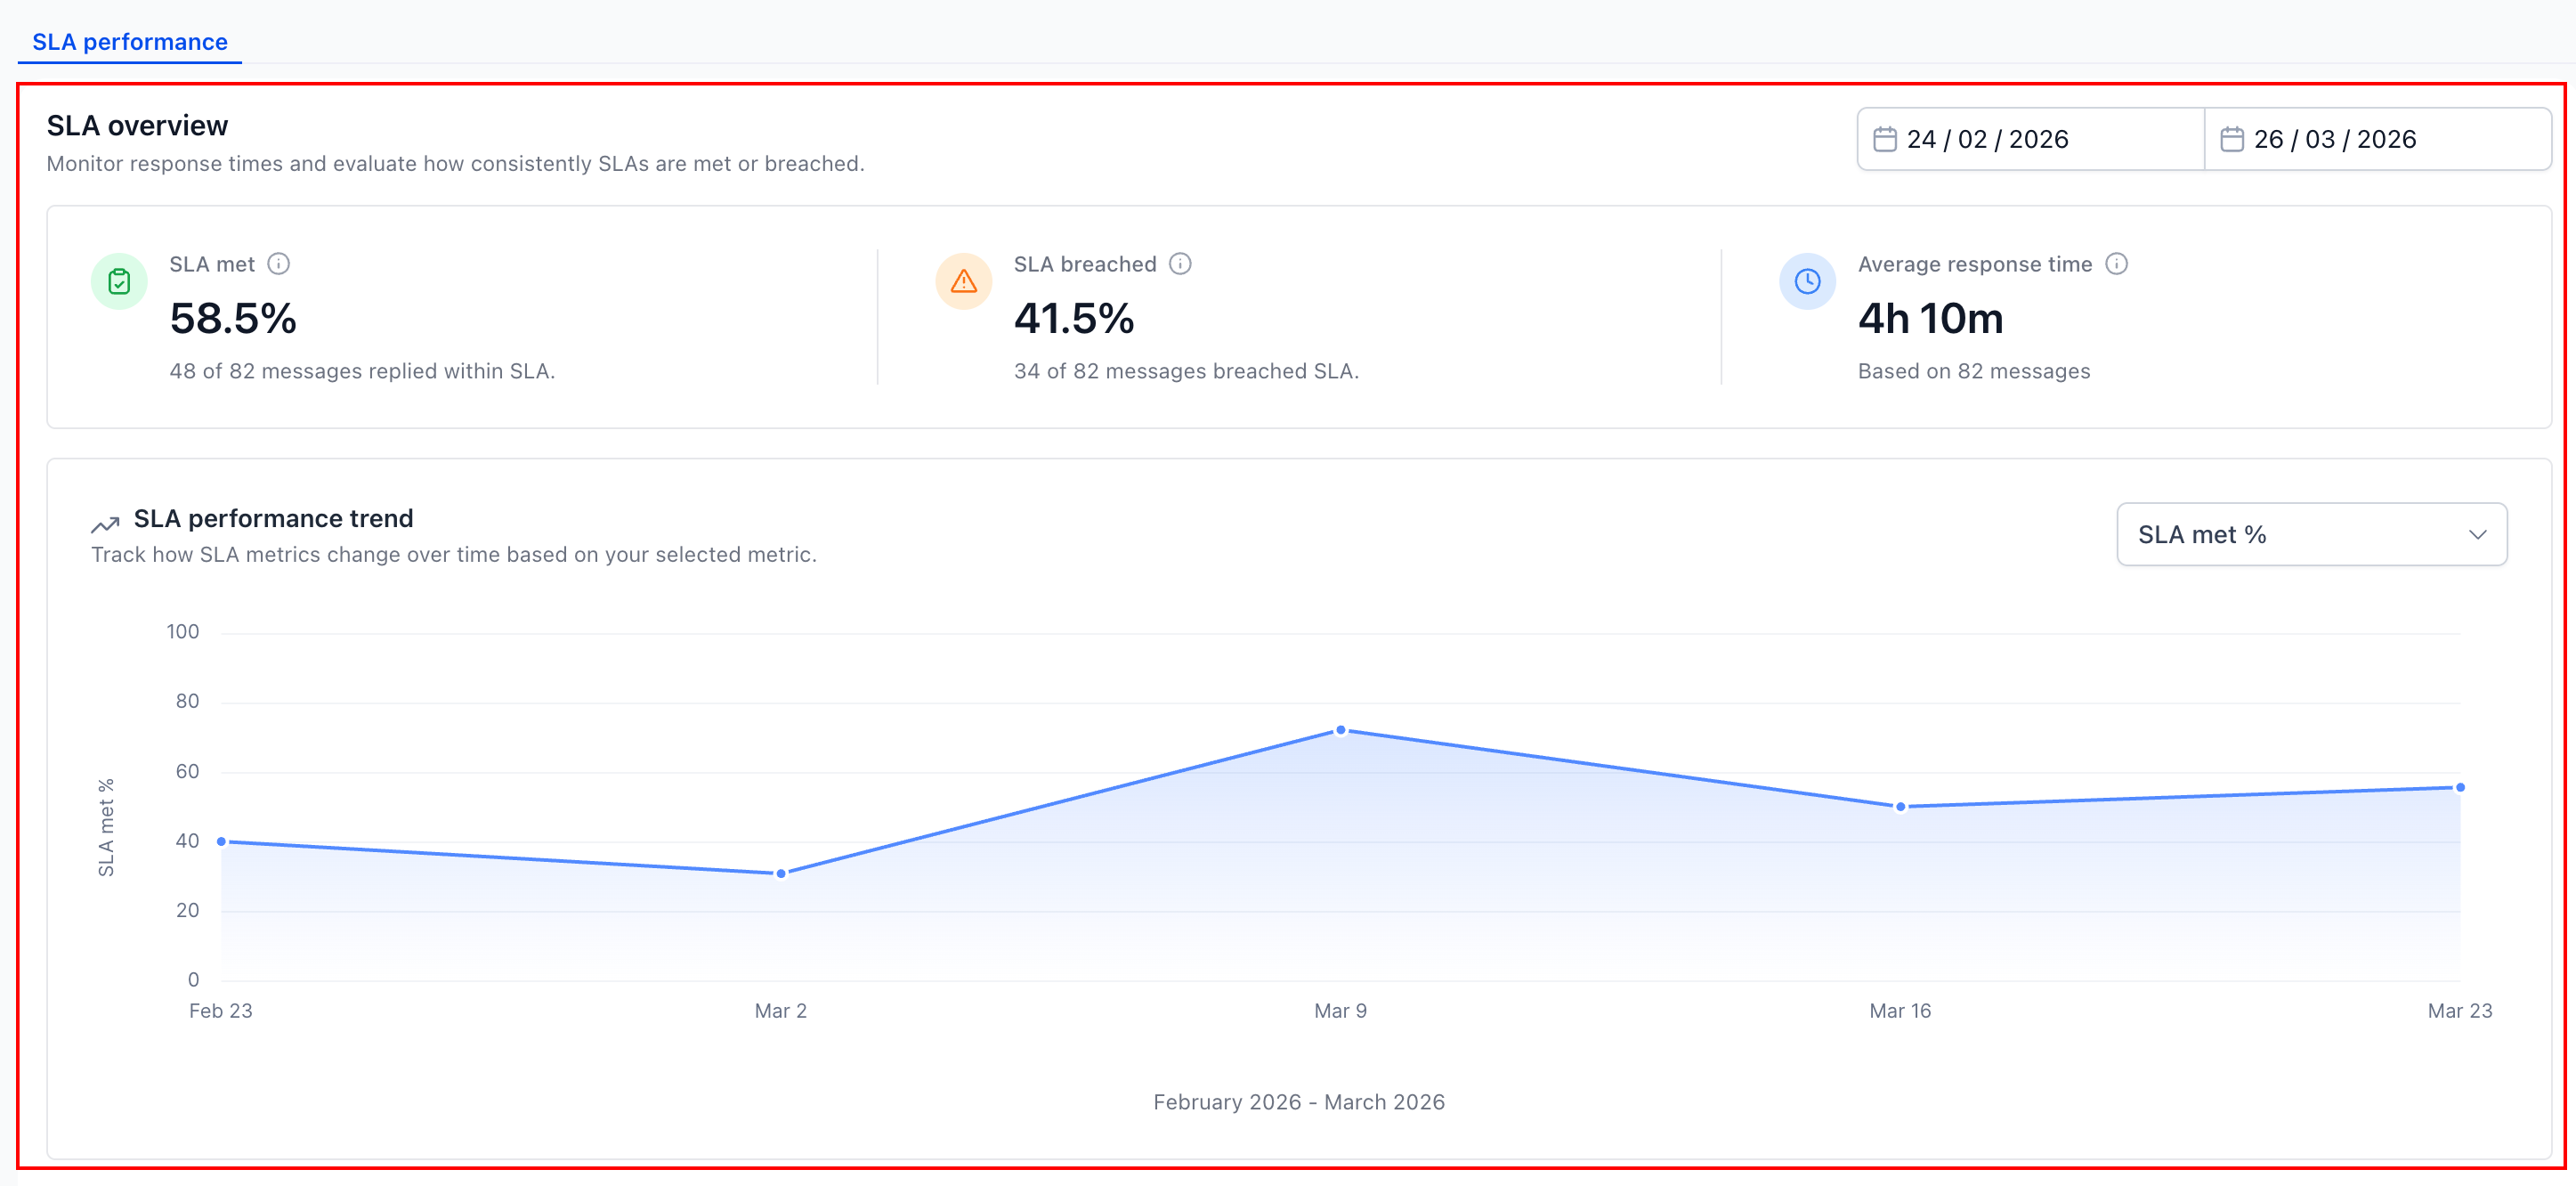
Review the overview section for a summary of SLA performance, including a percentage breakdown of the SLAs that were breached and met, and the average response time.
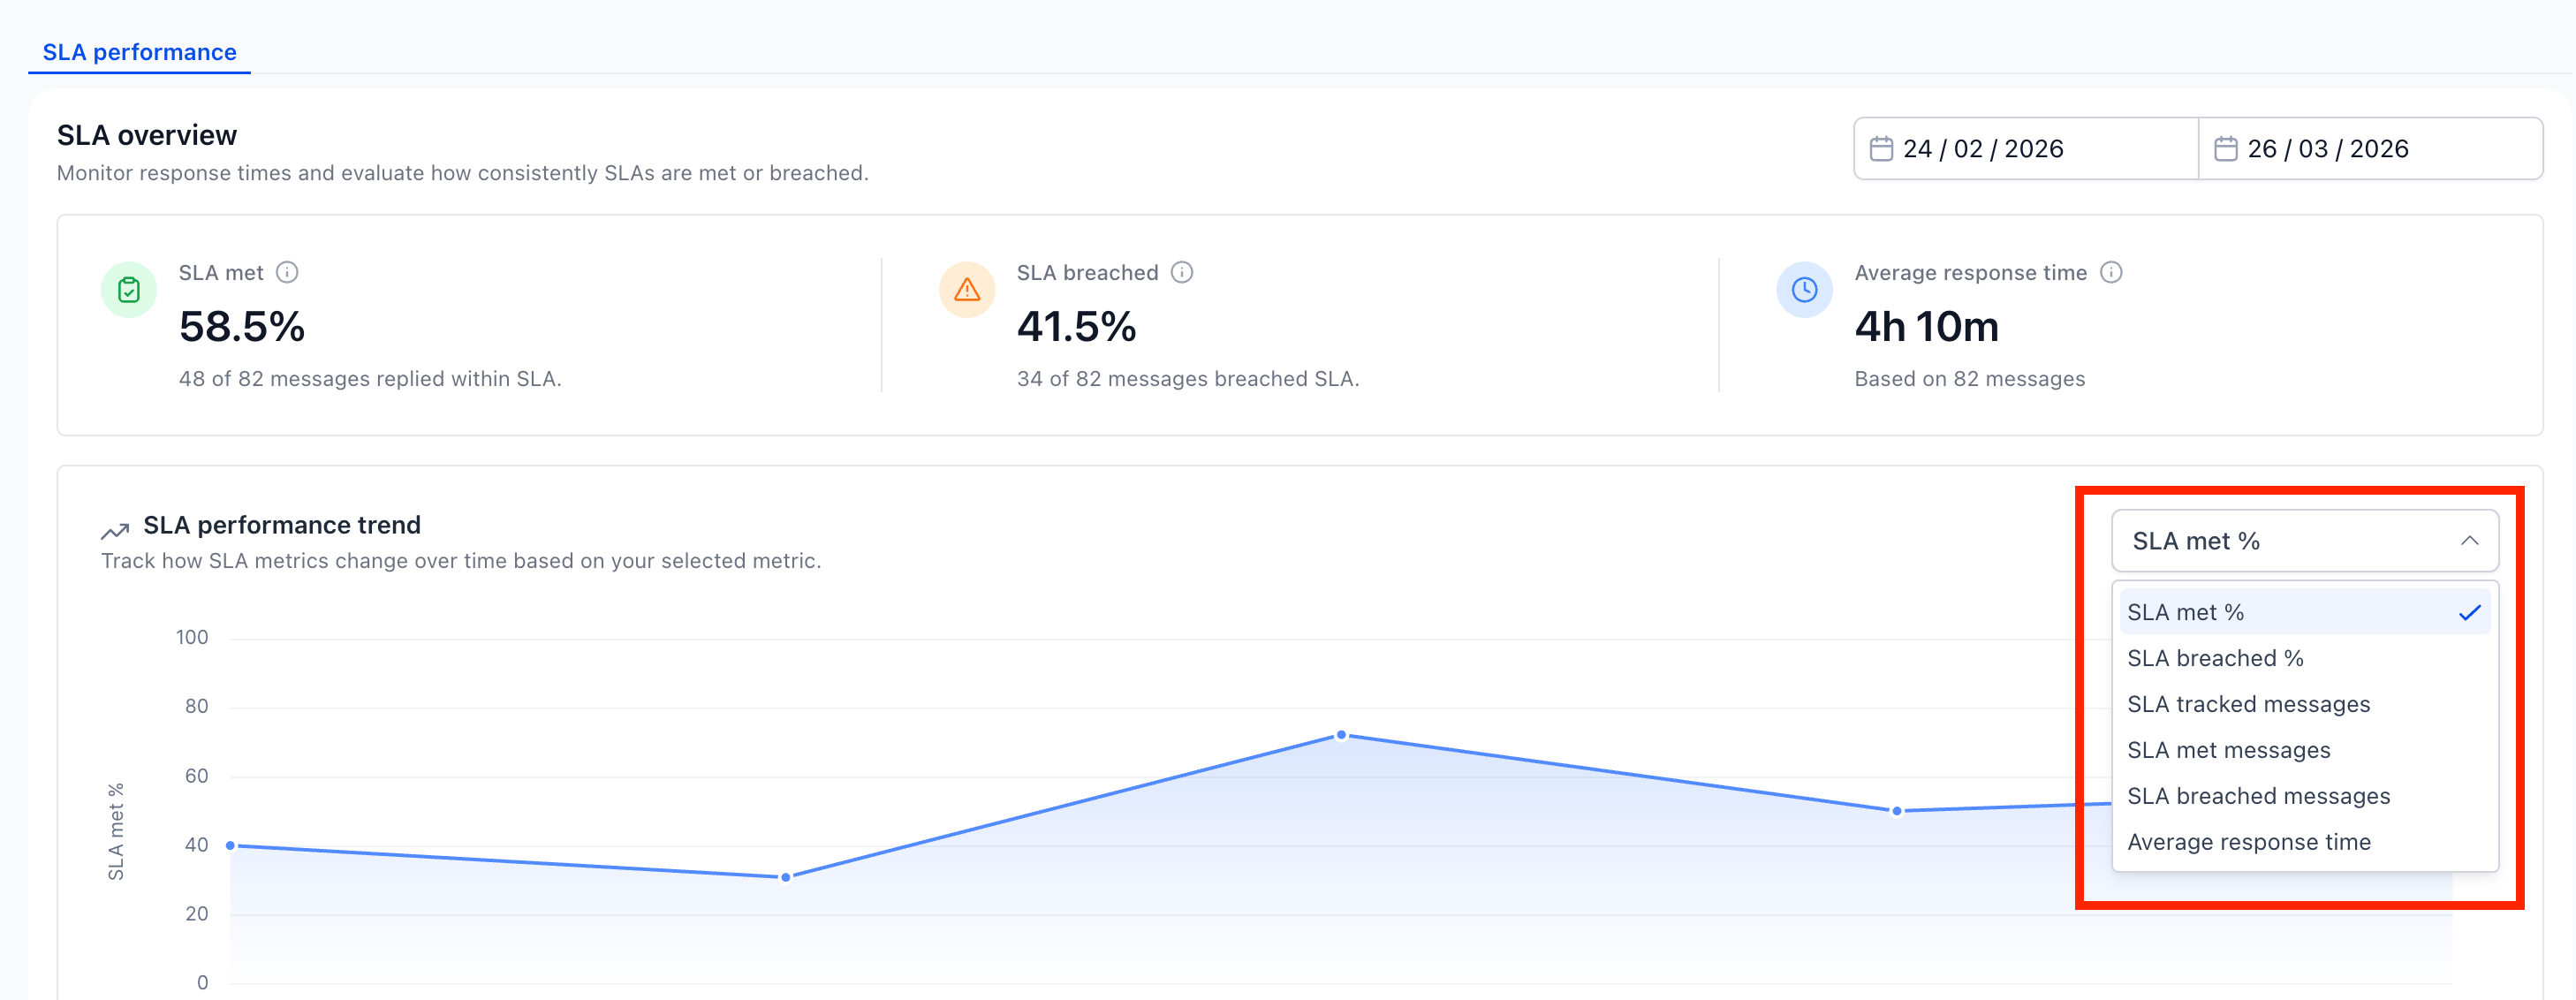
Use the trend chart dropdown to view different metrics in the date range you selected.
Analyze user and channel reports, applying sorting and filters to drill into specific insights.
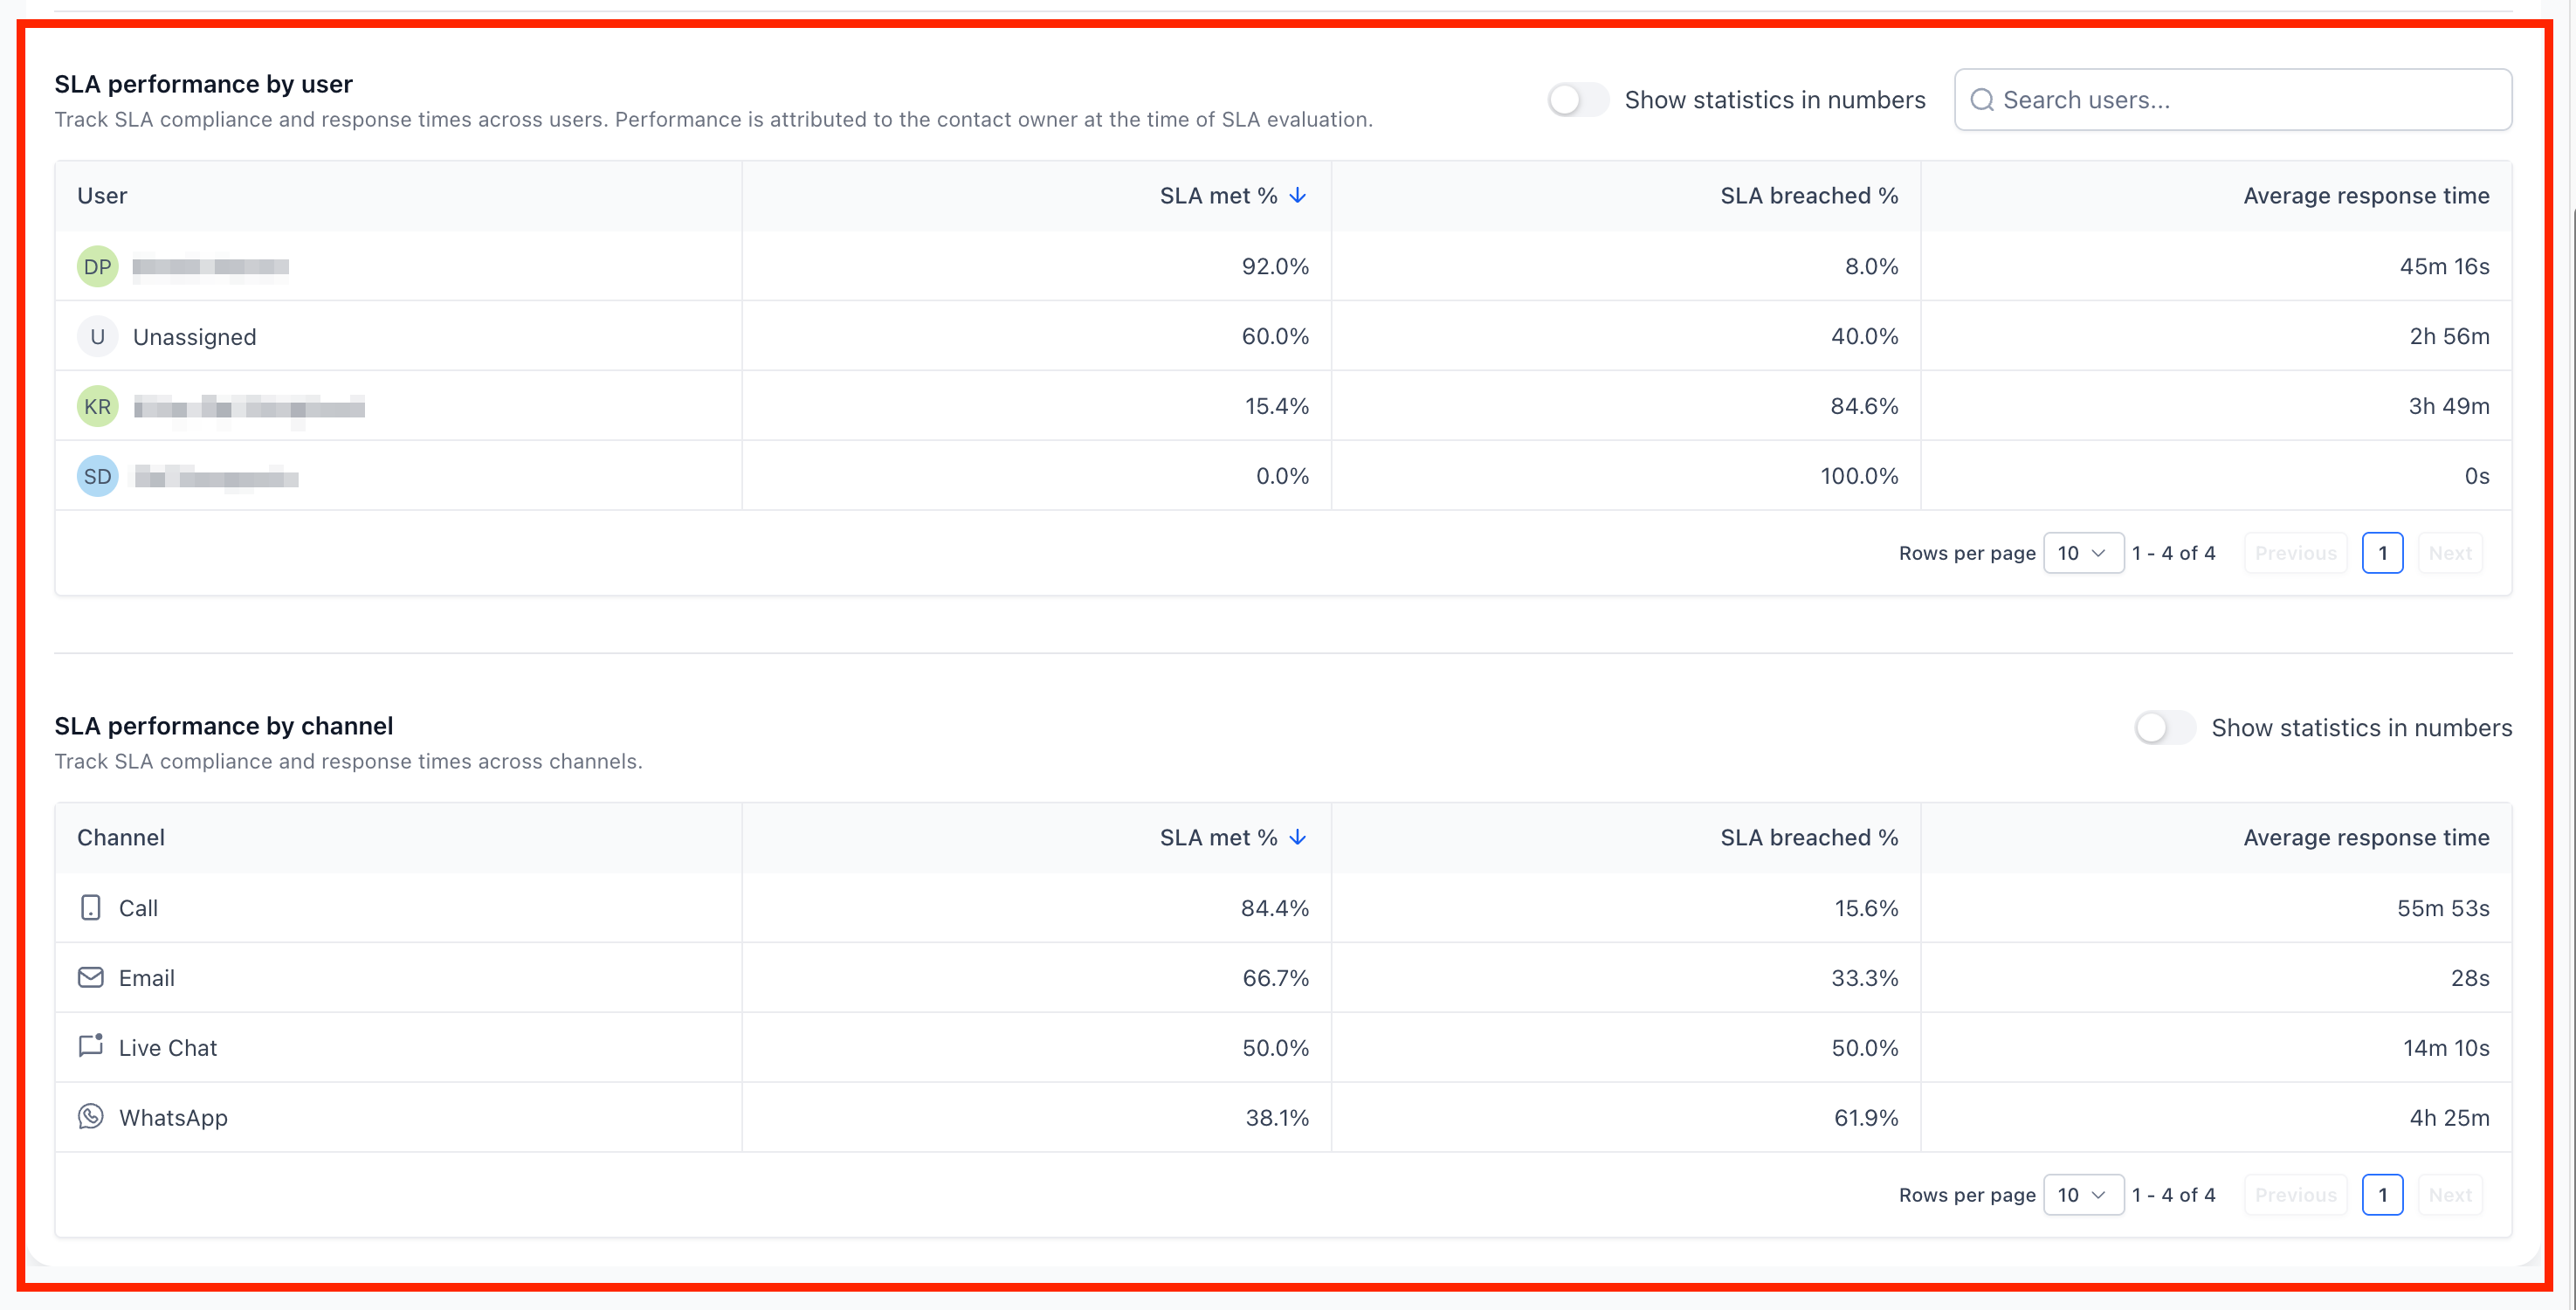
This structured approach allows you to quickly move from a broad overview to more detailed performance analysis.
✍️Important Notes
- Only messages with completed SLA evaluations (met or breached) are included in reports
- Conversations marked as read without a reply are excluded
- SLA performance is attributed to the assigned user at the time of evaluation
- Access to SLA Performance reports is limited to Admins
Not a Funnelbud customer yet?
Try our all-in-one CRM for sales and marketing — free for 7 days, no commitment.