Agency Dashboard
The agency dashboard has three primary tabs for agency users to get a feel of what is going on in their company: Summary, Rebilling, and SaaS. This is the first page that loads when logging into an agency account, so let’s go through it.
Summary
Here, you can see an overview of the revenue and customers generated from SaaS, Reselling, and Rebilling.

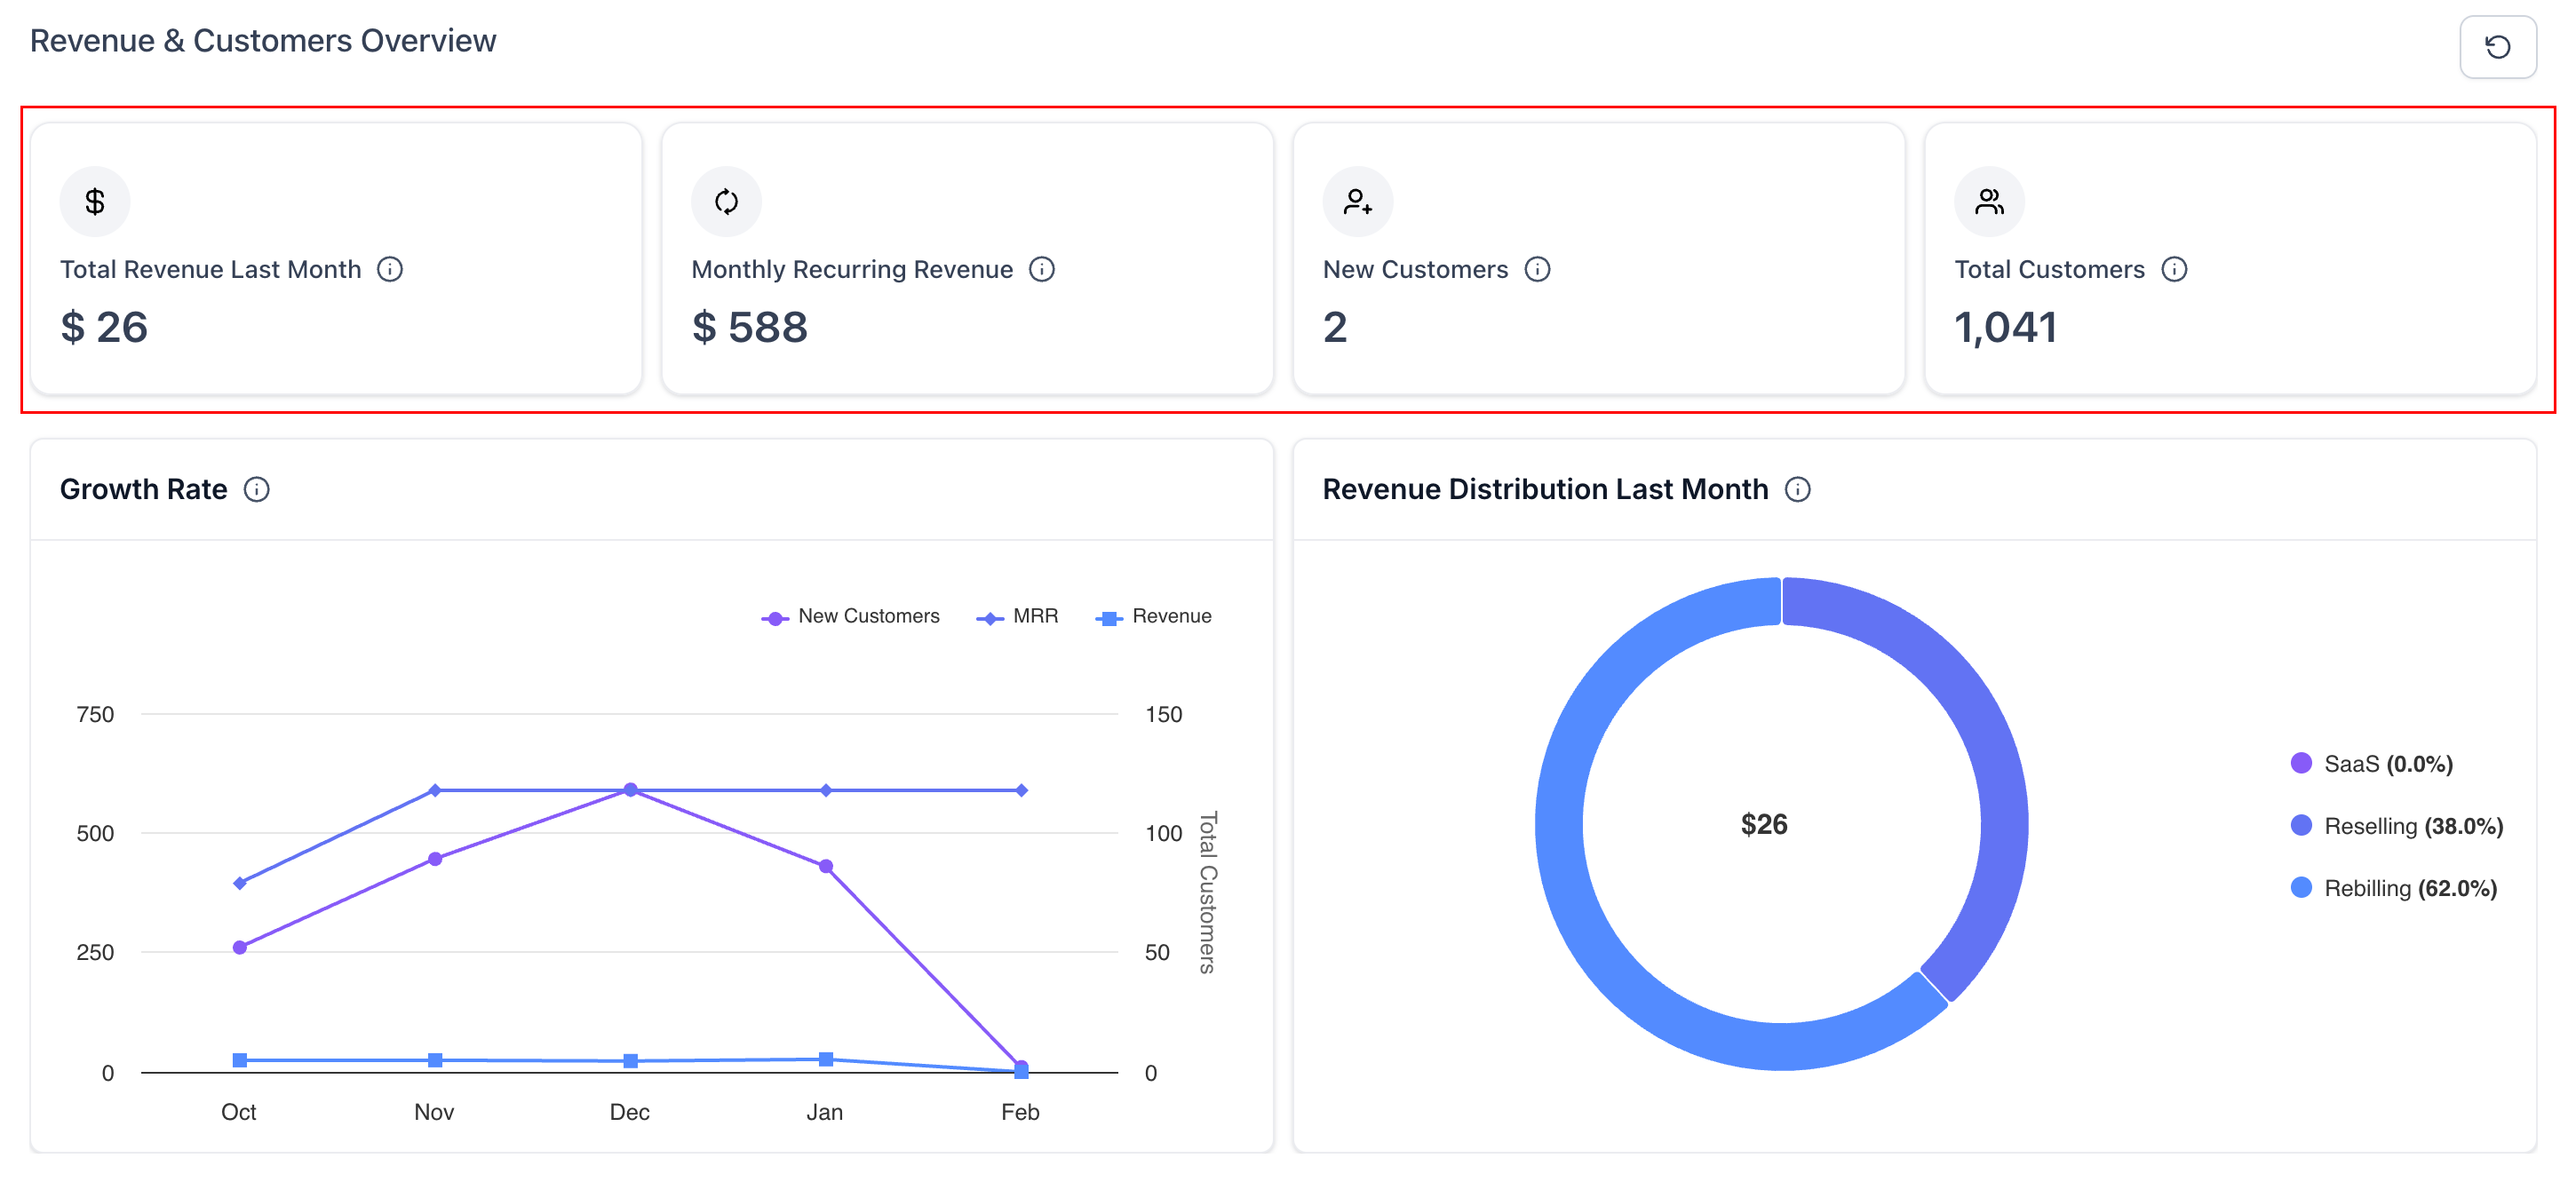
The KPI cards display key revenue metrics based only on qualifying platform-backed revenue, including Total Revenue (Last Month), Monthly Recurring Revenue (MRR), New Customers, and Total Customers.
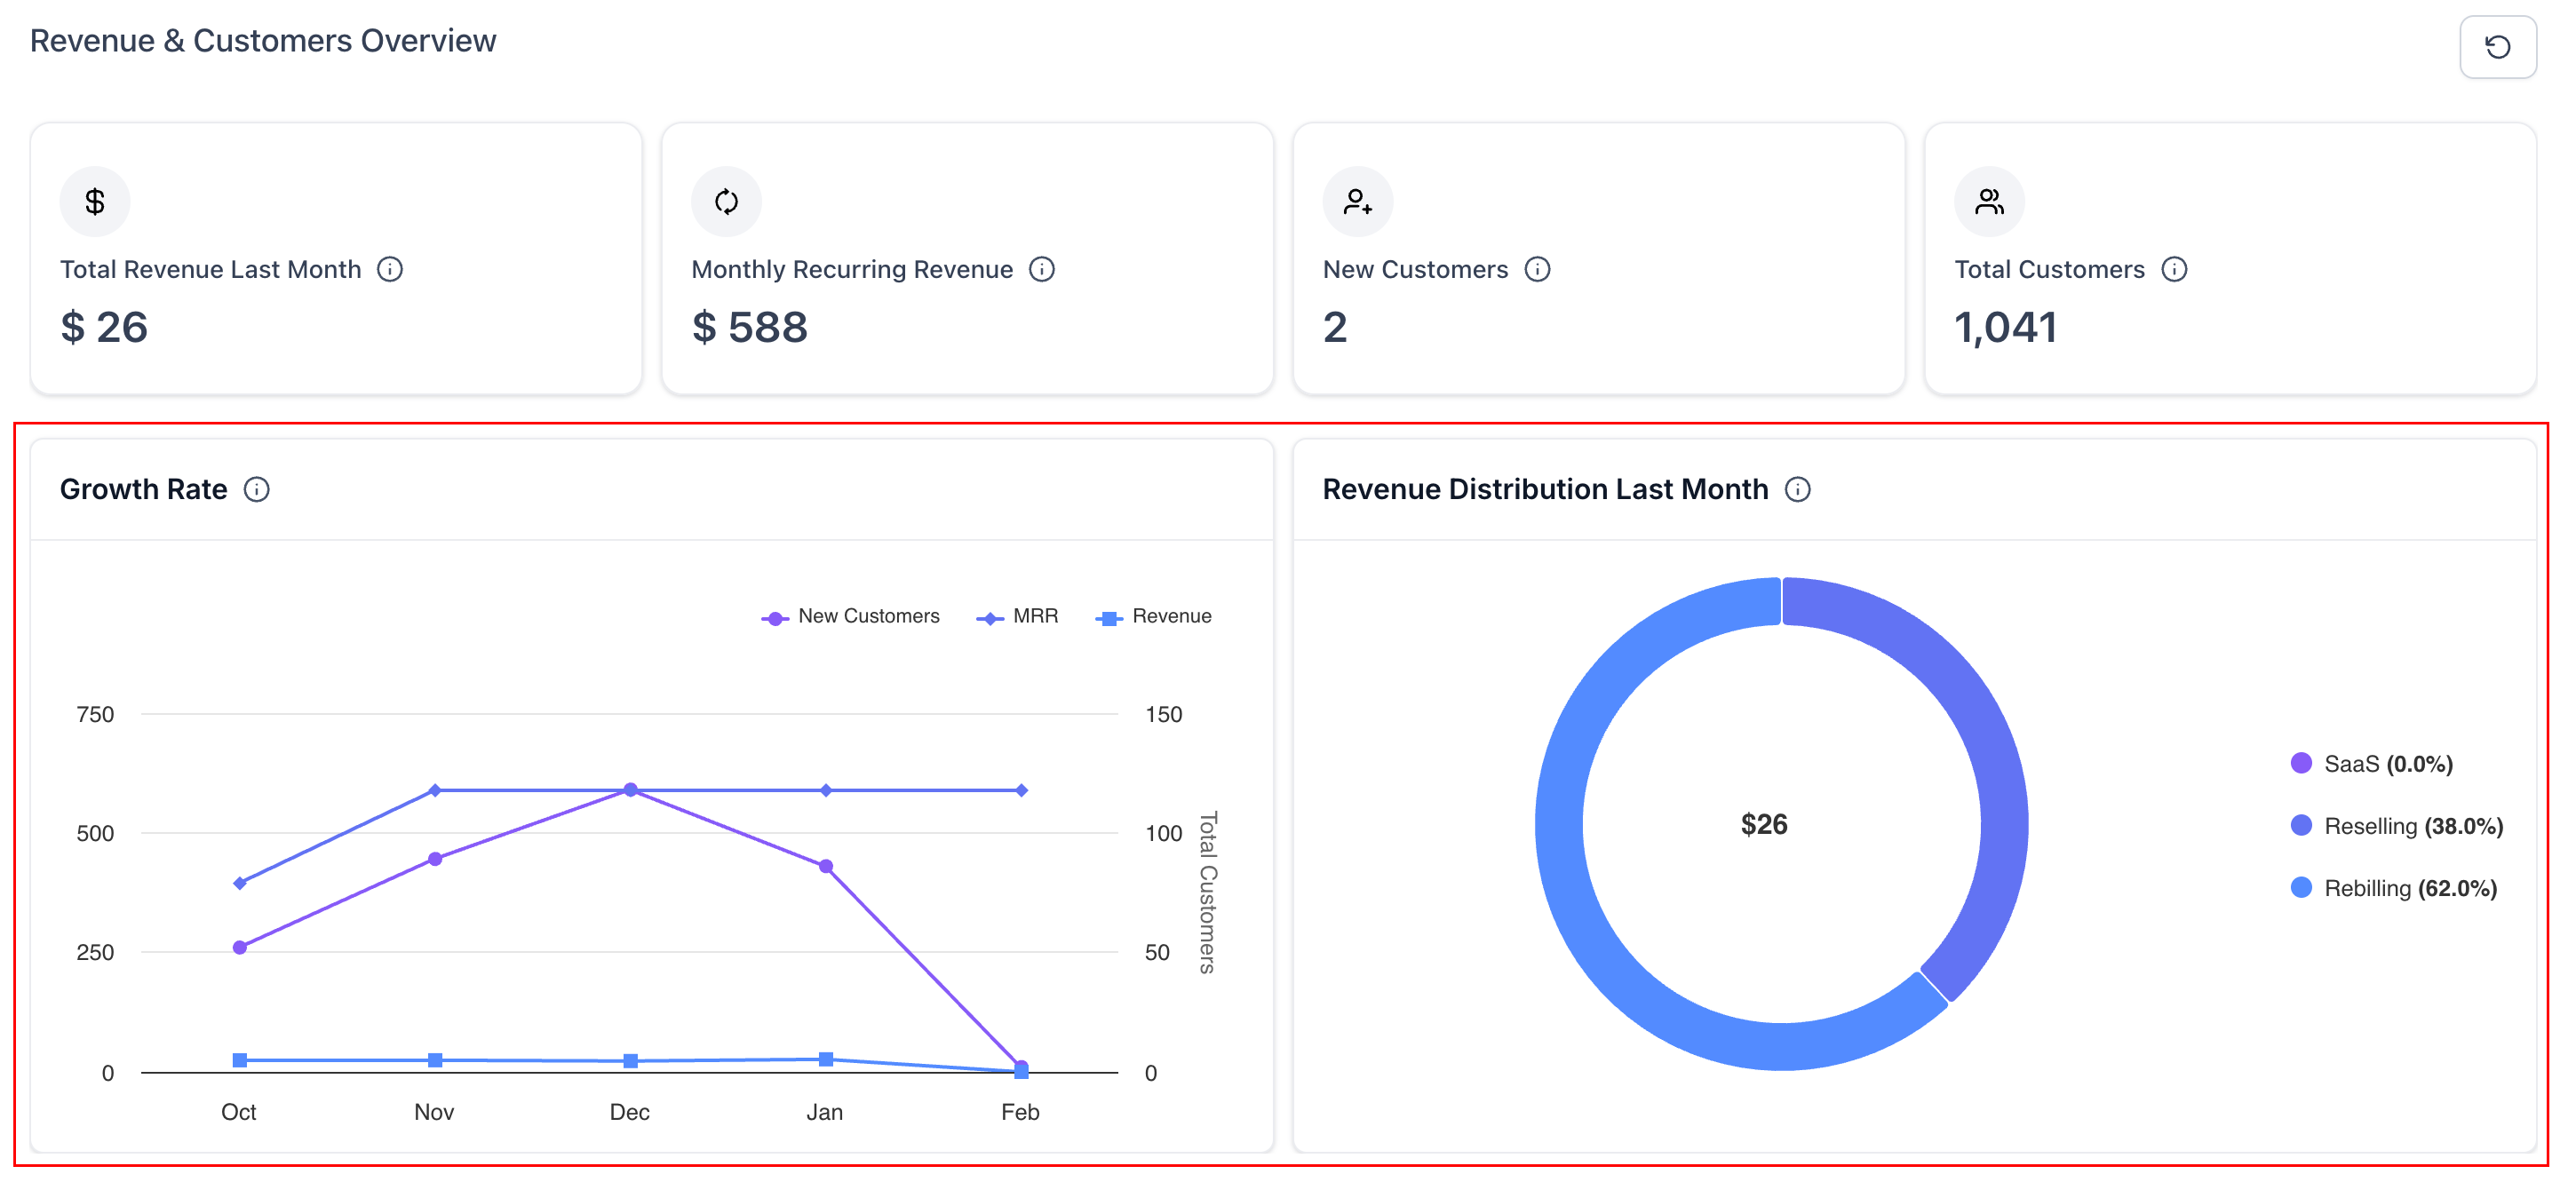
The Growth Rate chart aligns with the updated Revenue and MRR calculations, while the Revenue Distribution (Last Month) chart provides a breakdown of the previous month’s revenue across SaaS, reselling, and rebilling categories.
SaaS
The SaaS Analytics tab provides a comprehensive analytical view of your SaaS business by combining revenue and customer metrics with plan-level insights and cohort data, enabling you to monitor MRR, churn, upgrades and downgrades, ARPA, and other key performance indicators in a single location.

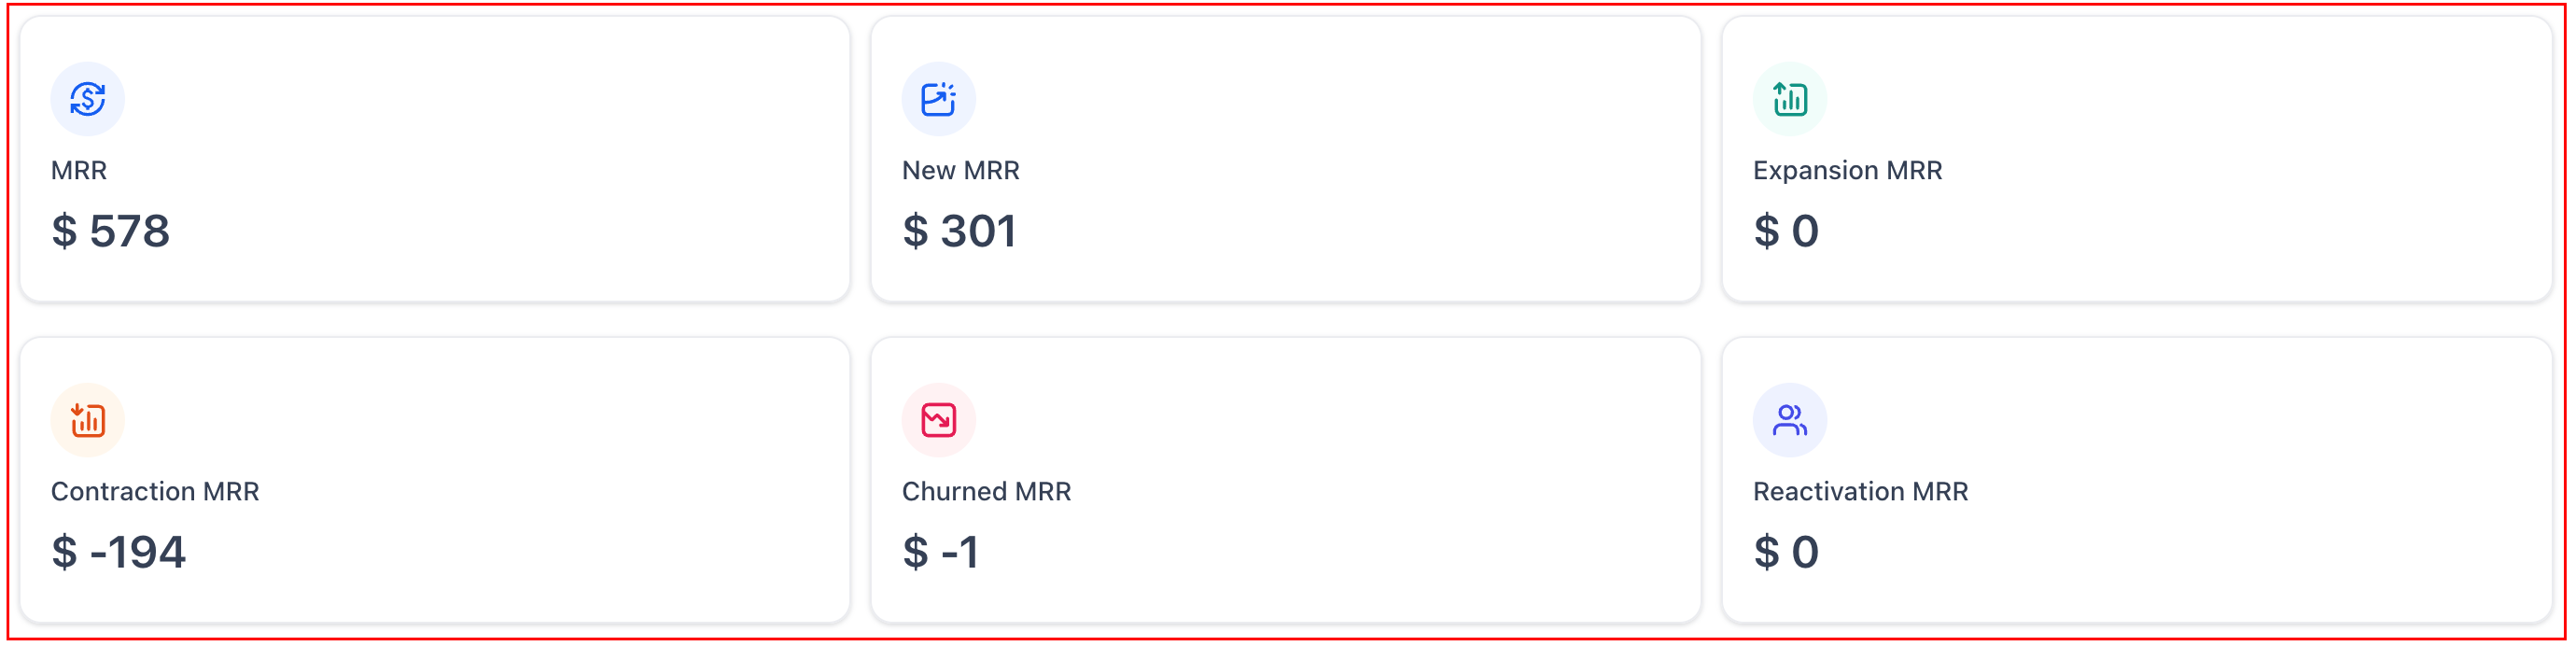
Review the MRR components, which include:
- MRR: Total monthly recurring revenue
- New MRR: First-time paid subscriptions or trial conversions
- Expansion MRR: Upgrades or added recurring value
- Contraction MRR: Downgrades or recurring value reductions
- Churned MRR: Cancellations or full lapses
- Reactivation MRR: Previously cancelled or paused subscriptions returning to paid status
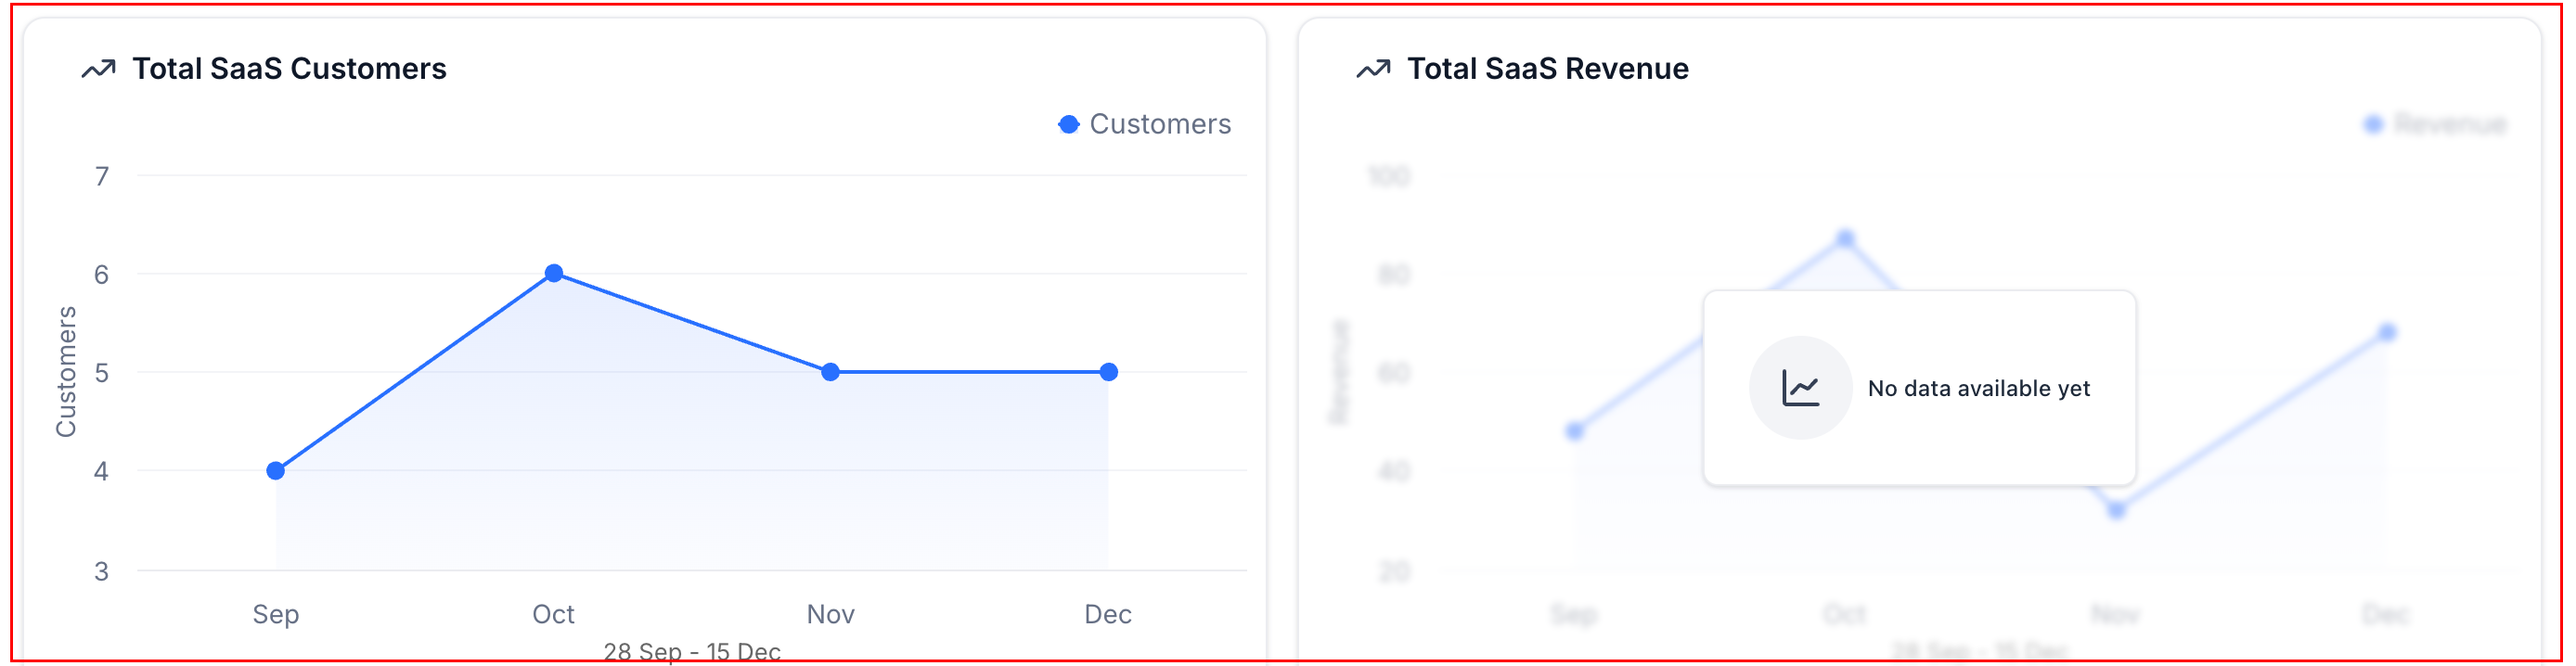
Scroll to view a chart of the total SaaS customers and revenue by month.
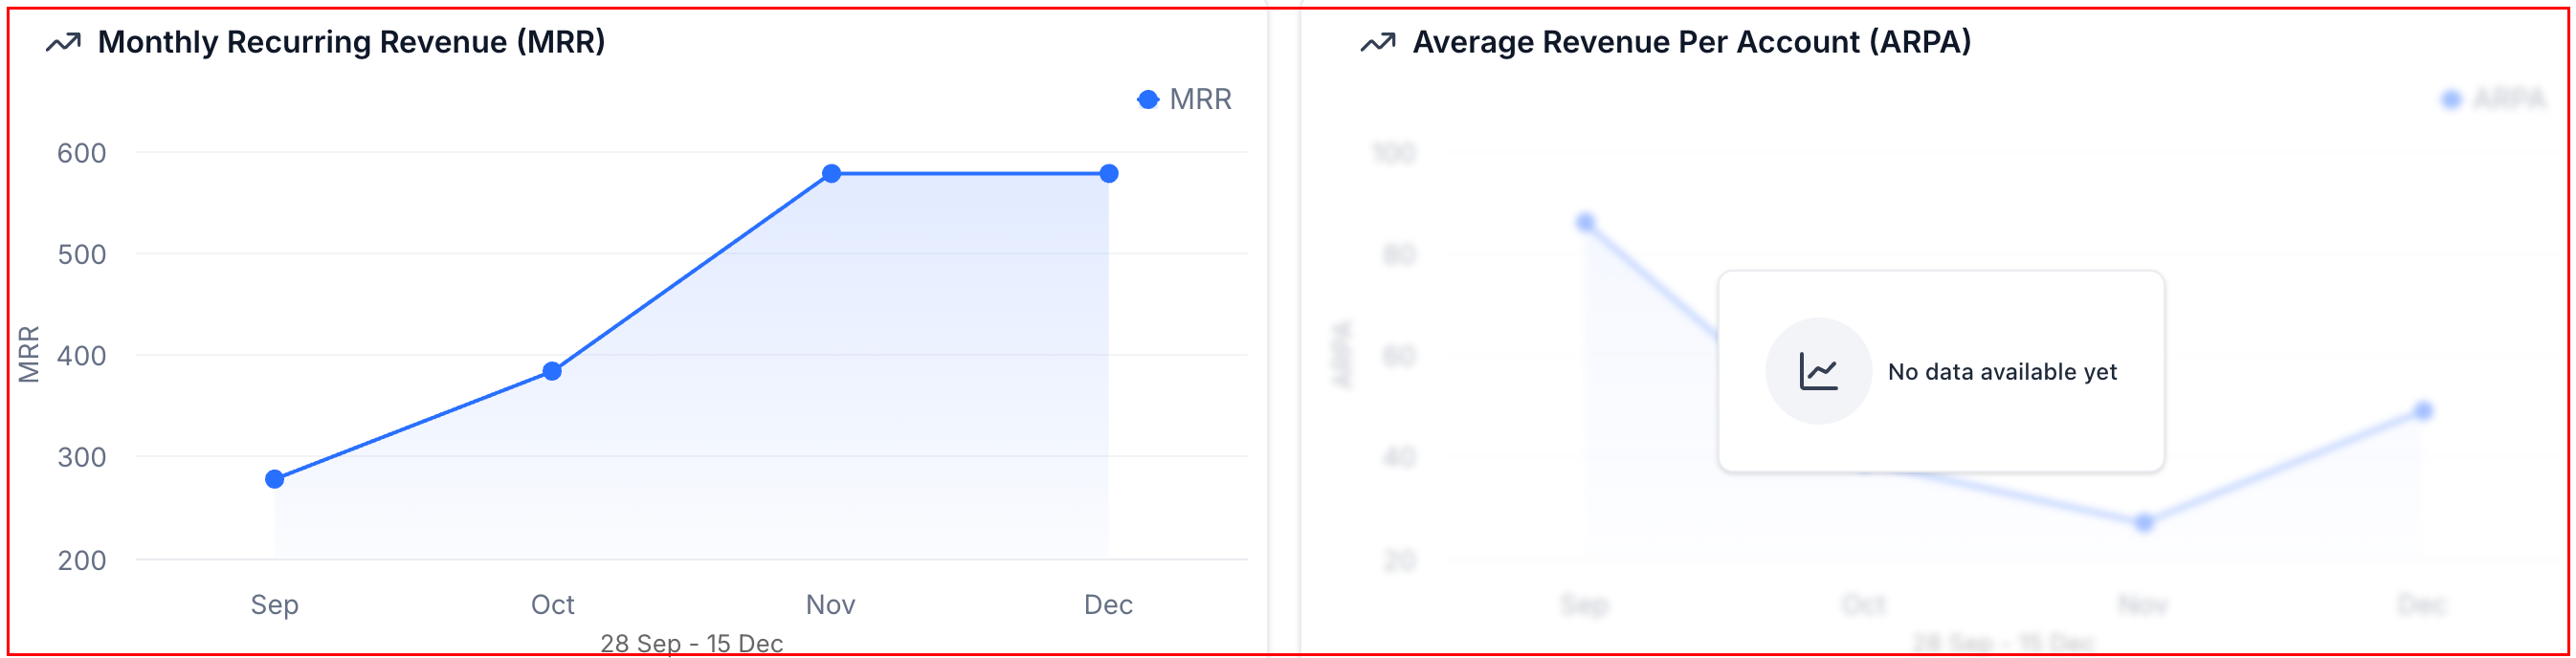
Below these, you will find the Total MRR by Month and Amount & Average Revenue Per Account (ARPA) graphs.
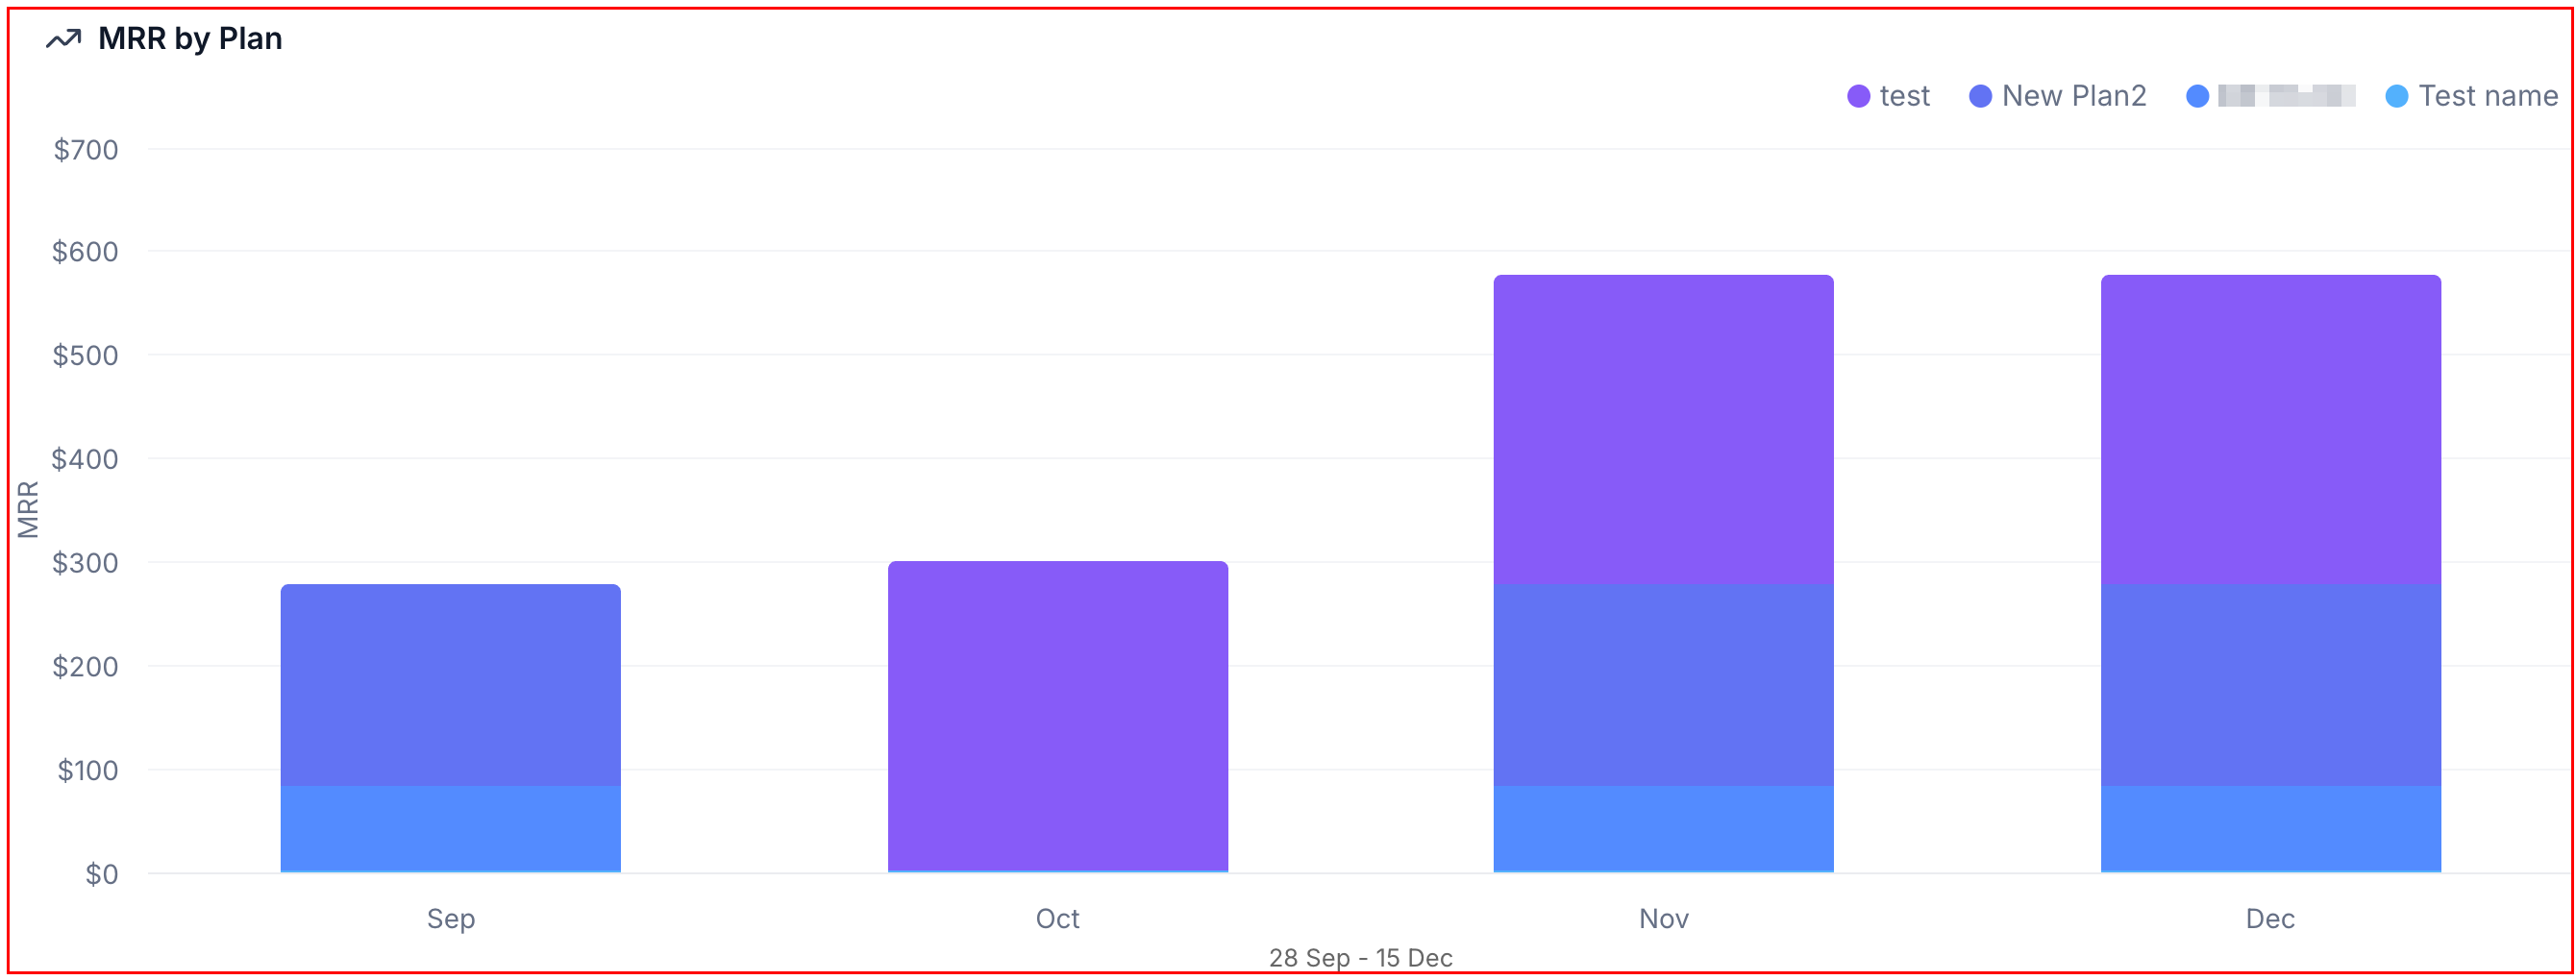
Use the MRR by Plan chart to see a visual representation of your revenue breakdown.
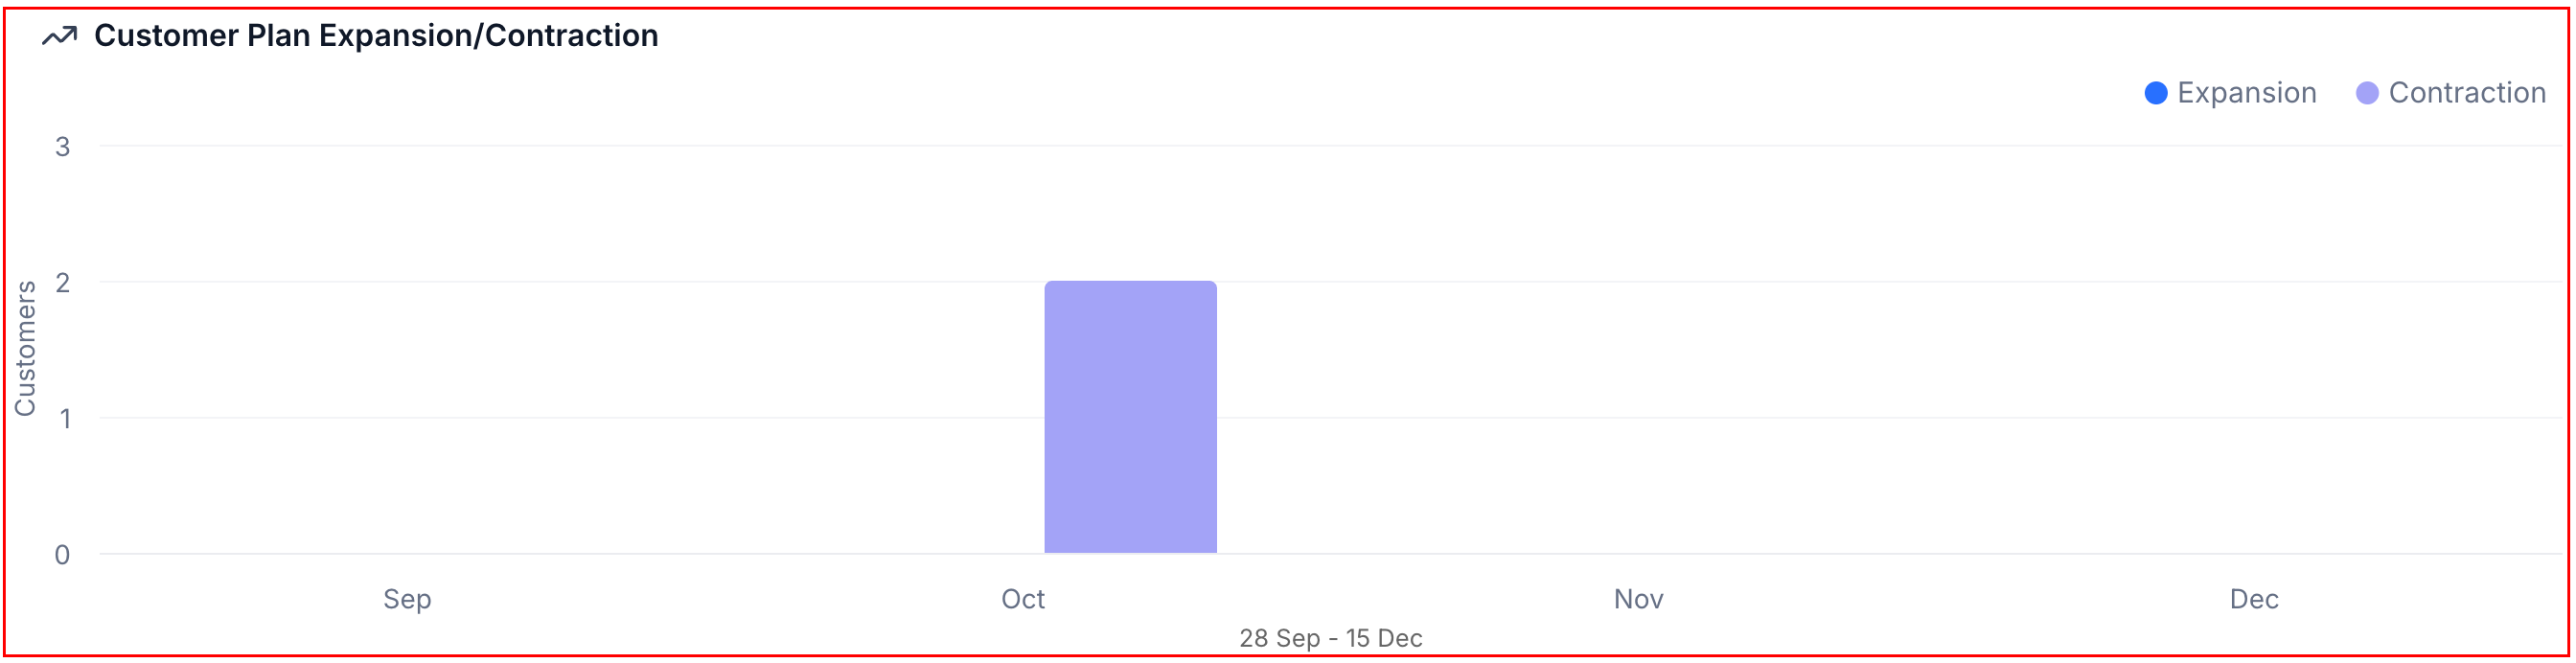
The Customer Plan Expansion/Contraction chart shows the number of customers who have upgraded or downgraded their plan over a defined period.
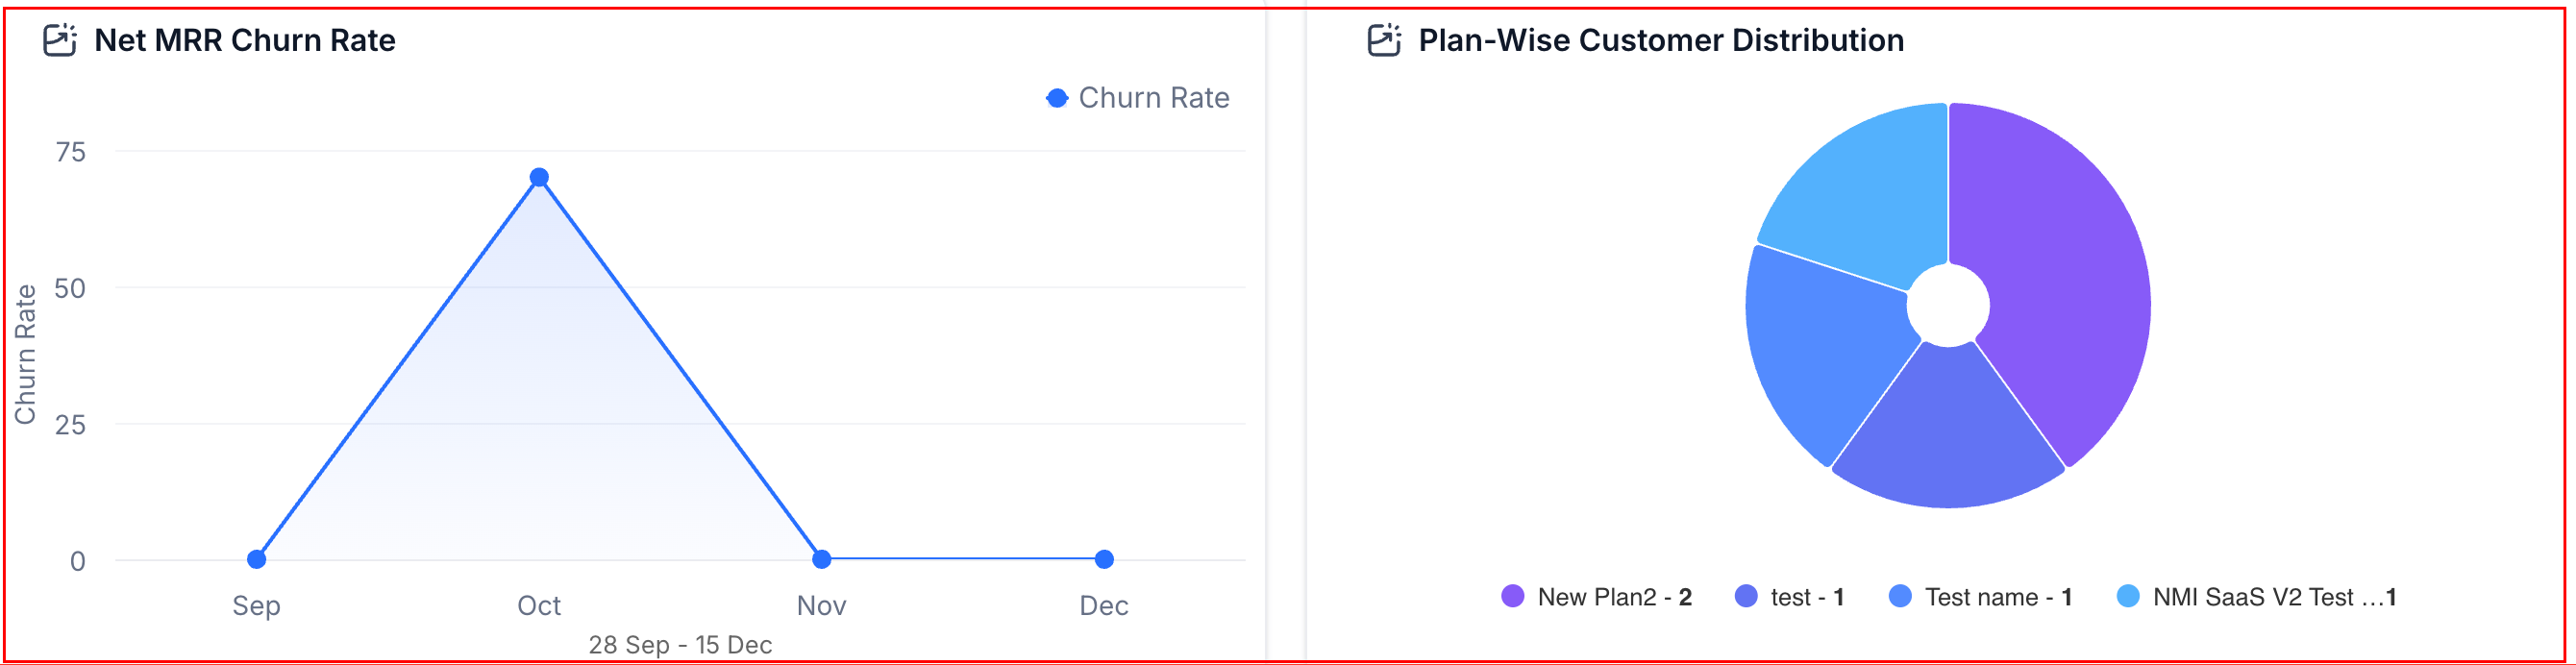
The last set of graphs in this section is:
- Net MRR Churn Rate, which is the percentage of monthly recurring revenue lost from existing customers over a given period after accounting for upgrades or expansions.
- Plan-Wise Customer Distribution, which shows how your total customers are divided across different subscription plans.
Reselling
Reselling is divided into two categories: Usage Products and Subscription Products.
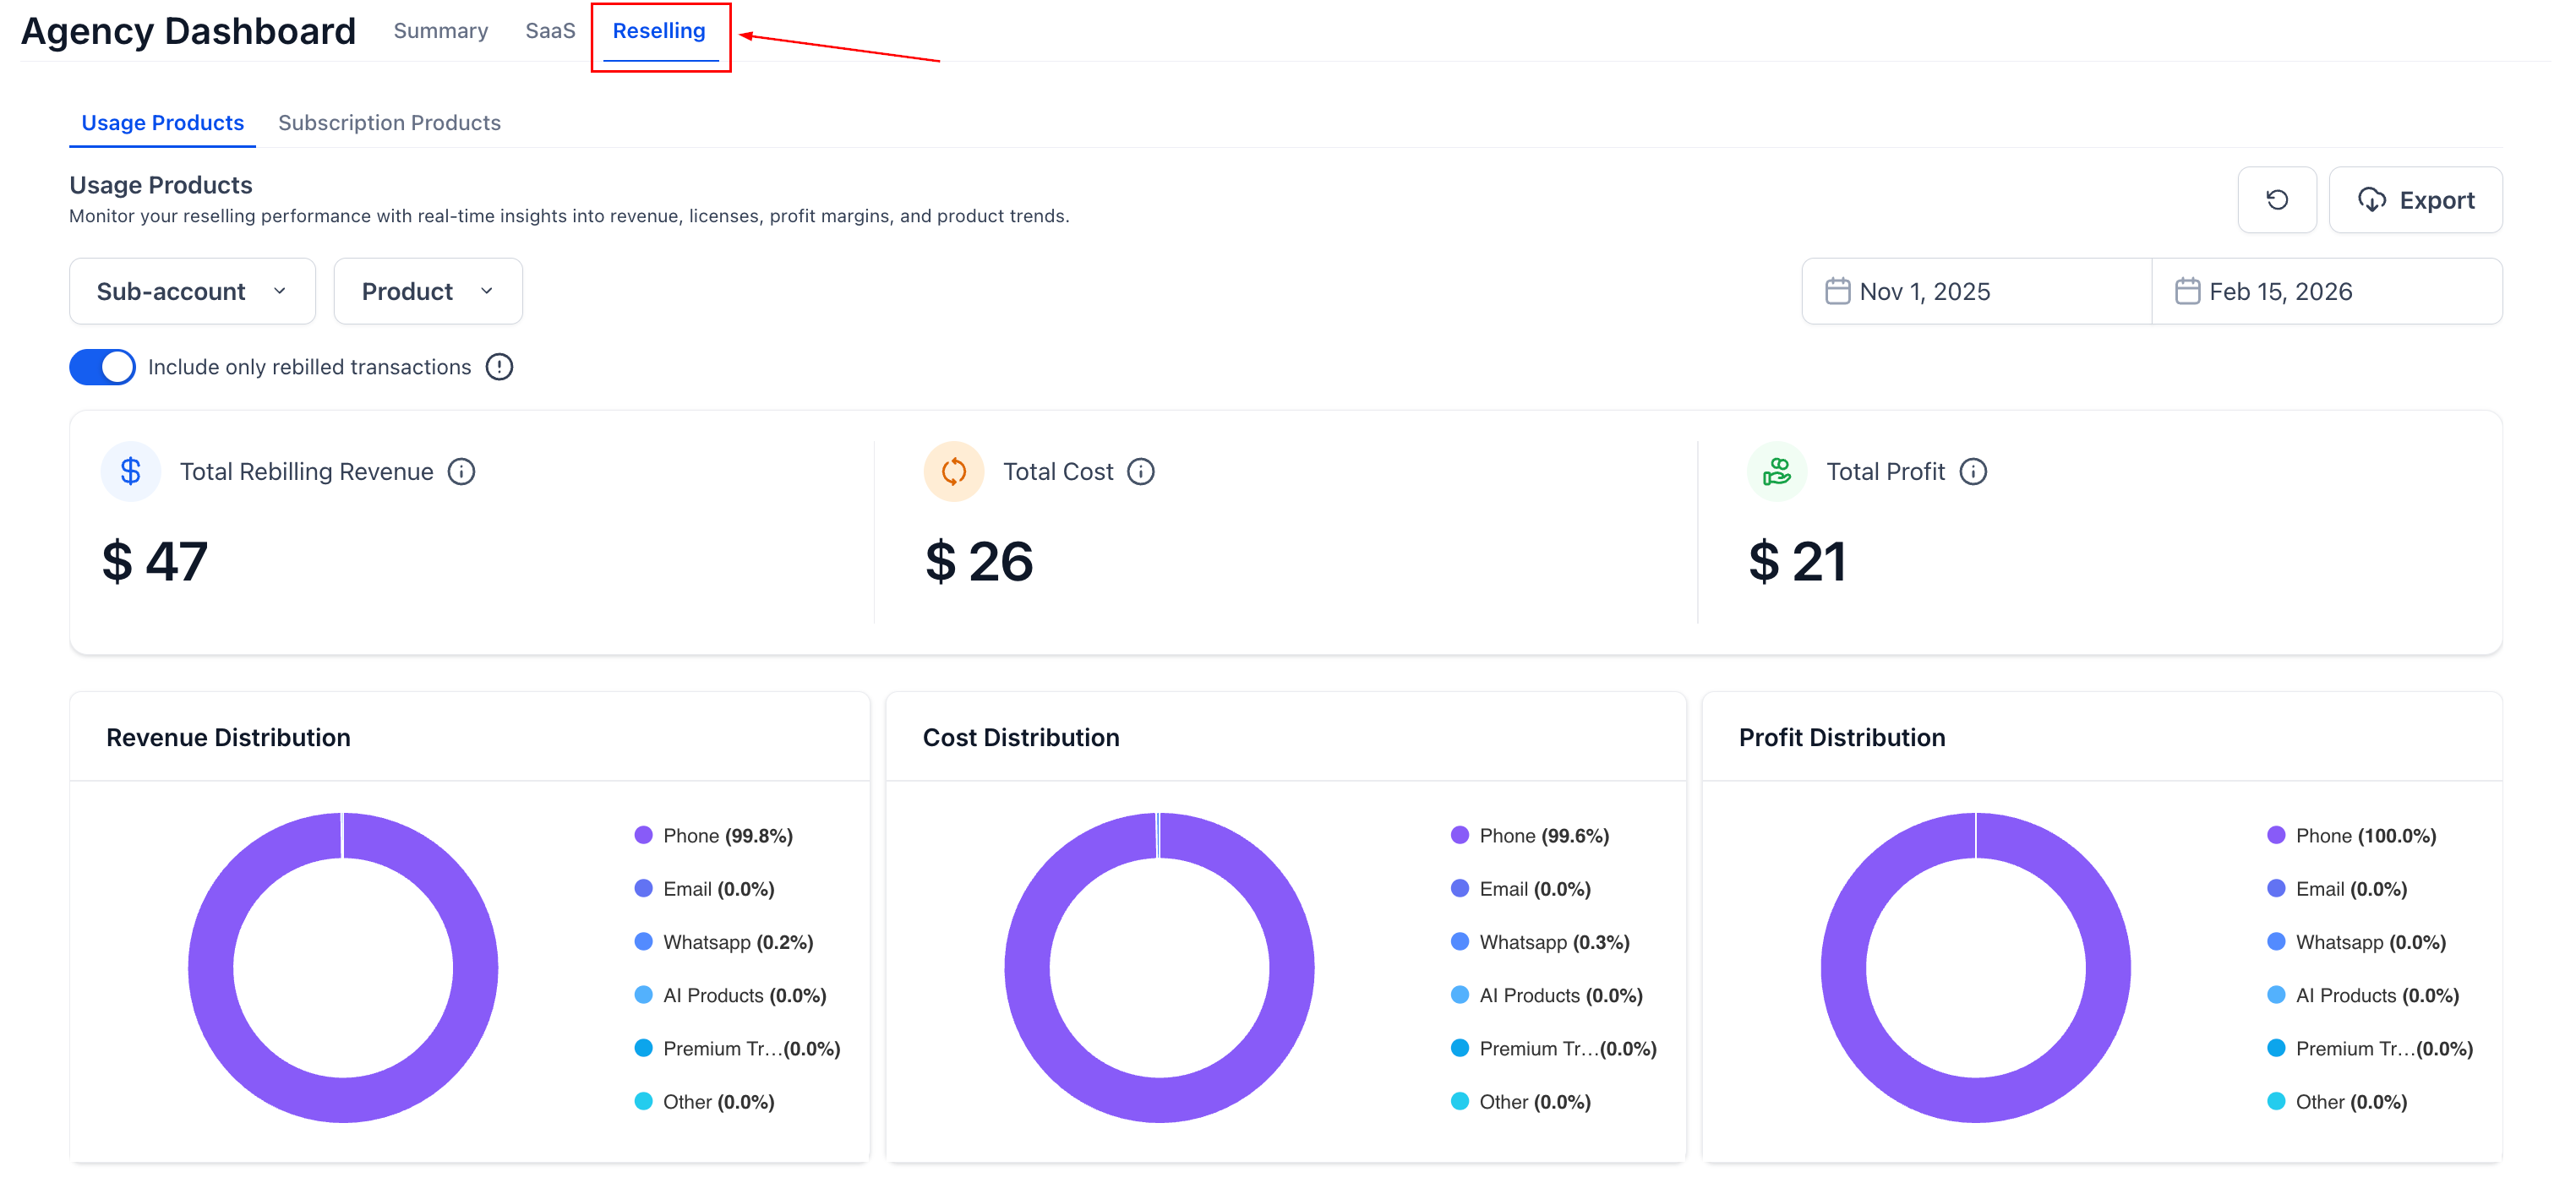
Usage Products
Here, you can monitor insights into the cost, profit, and revenue from usage-based products in your account.
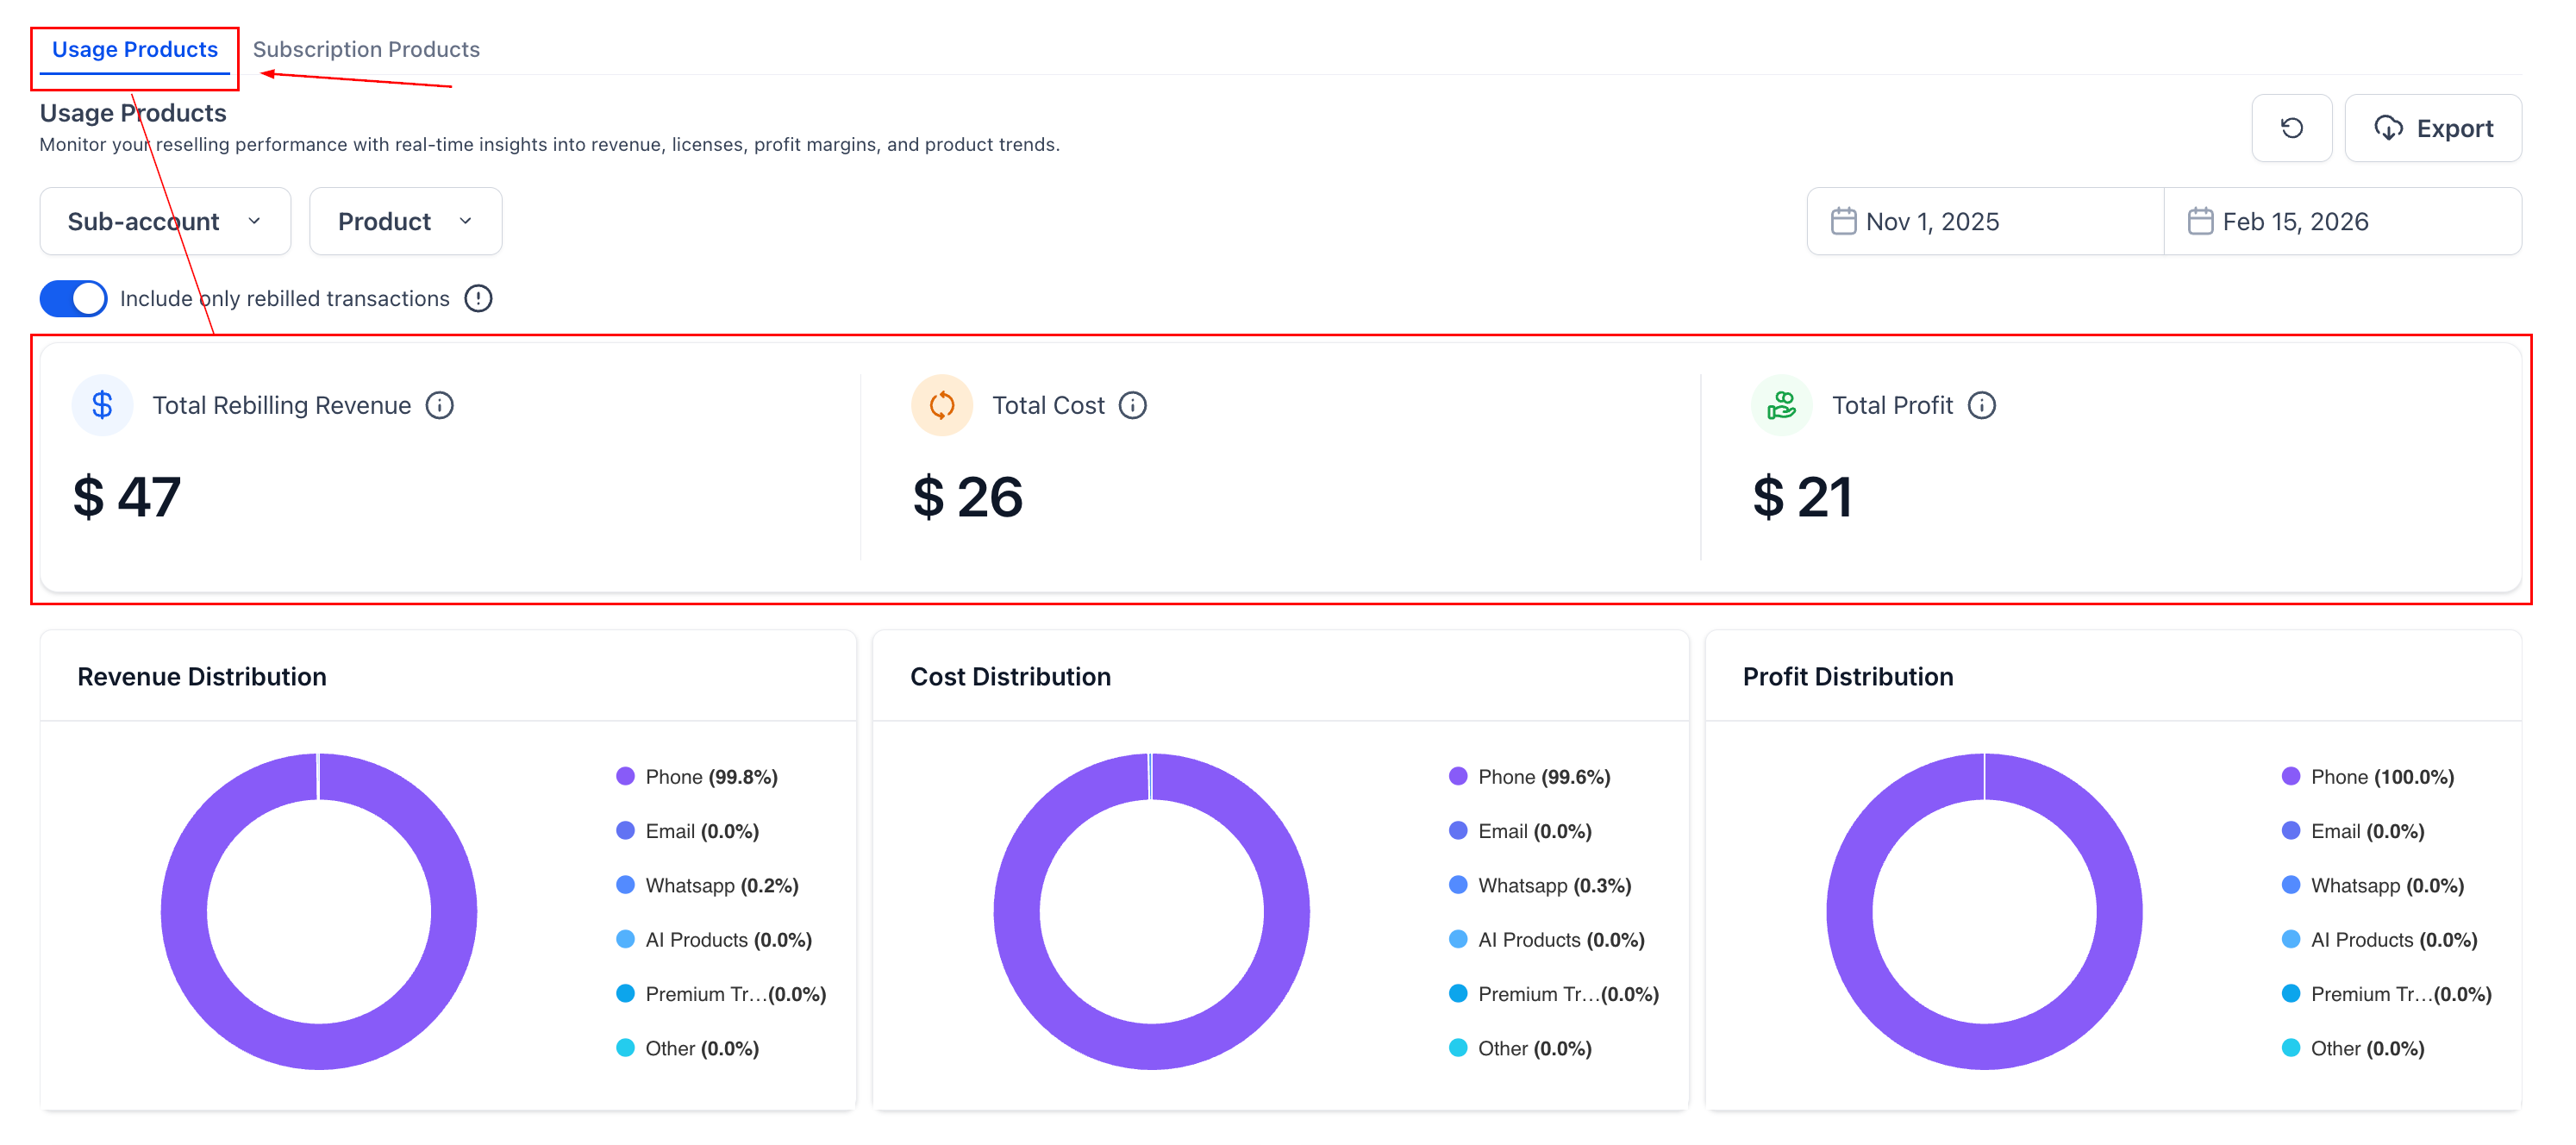
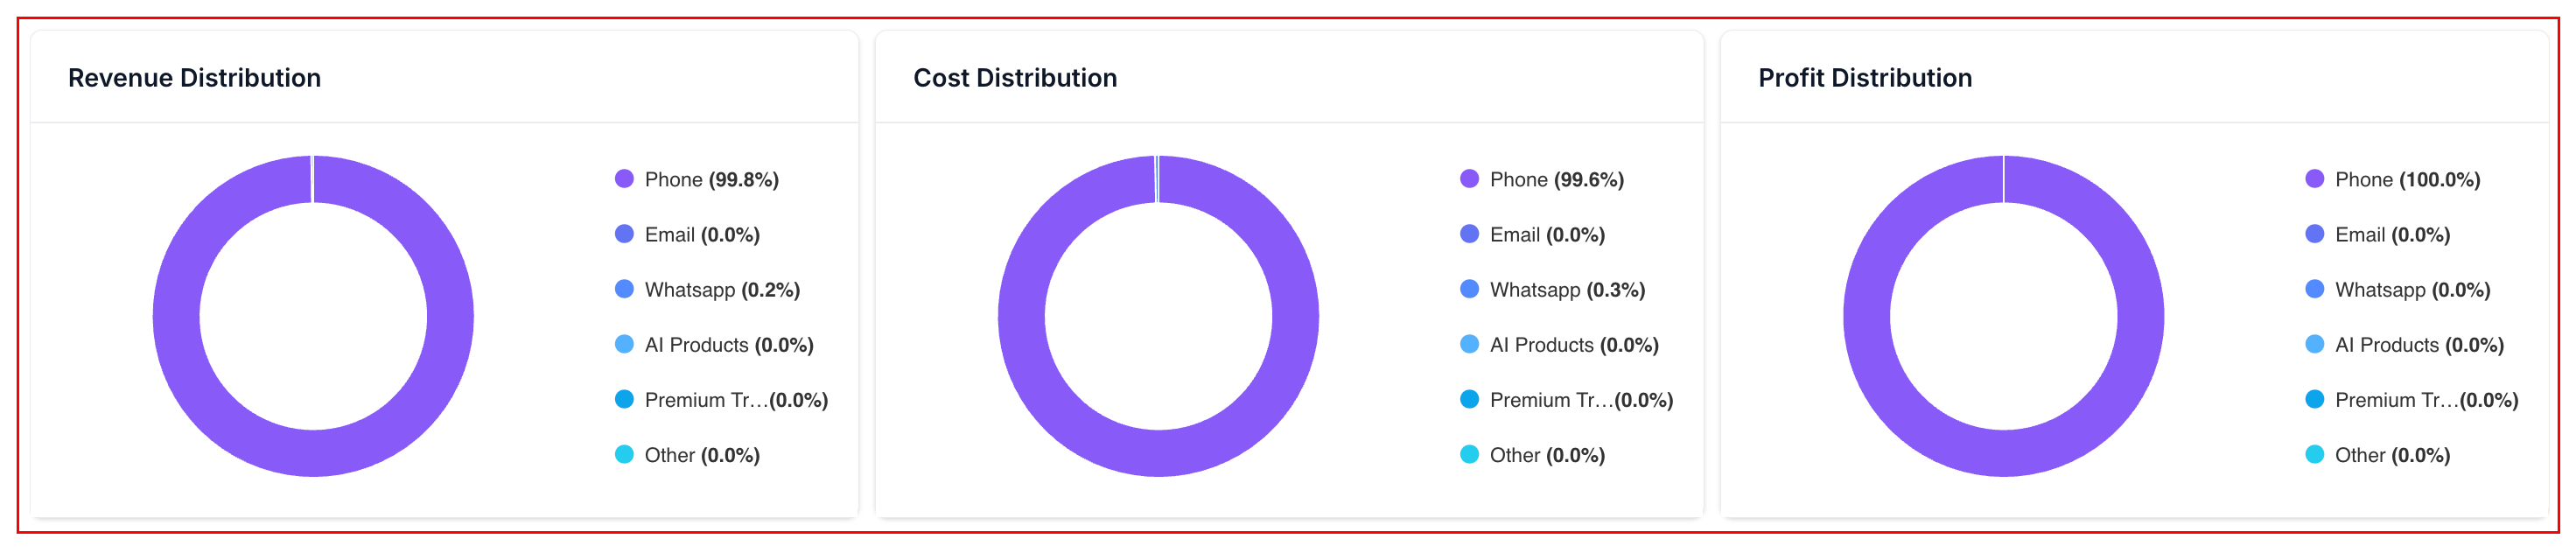
These factors will be further broken down by channel or product, such as WhatsApp, Phone, or Email, so that you can see the main source for your gains.
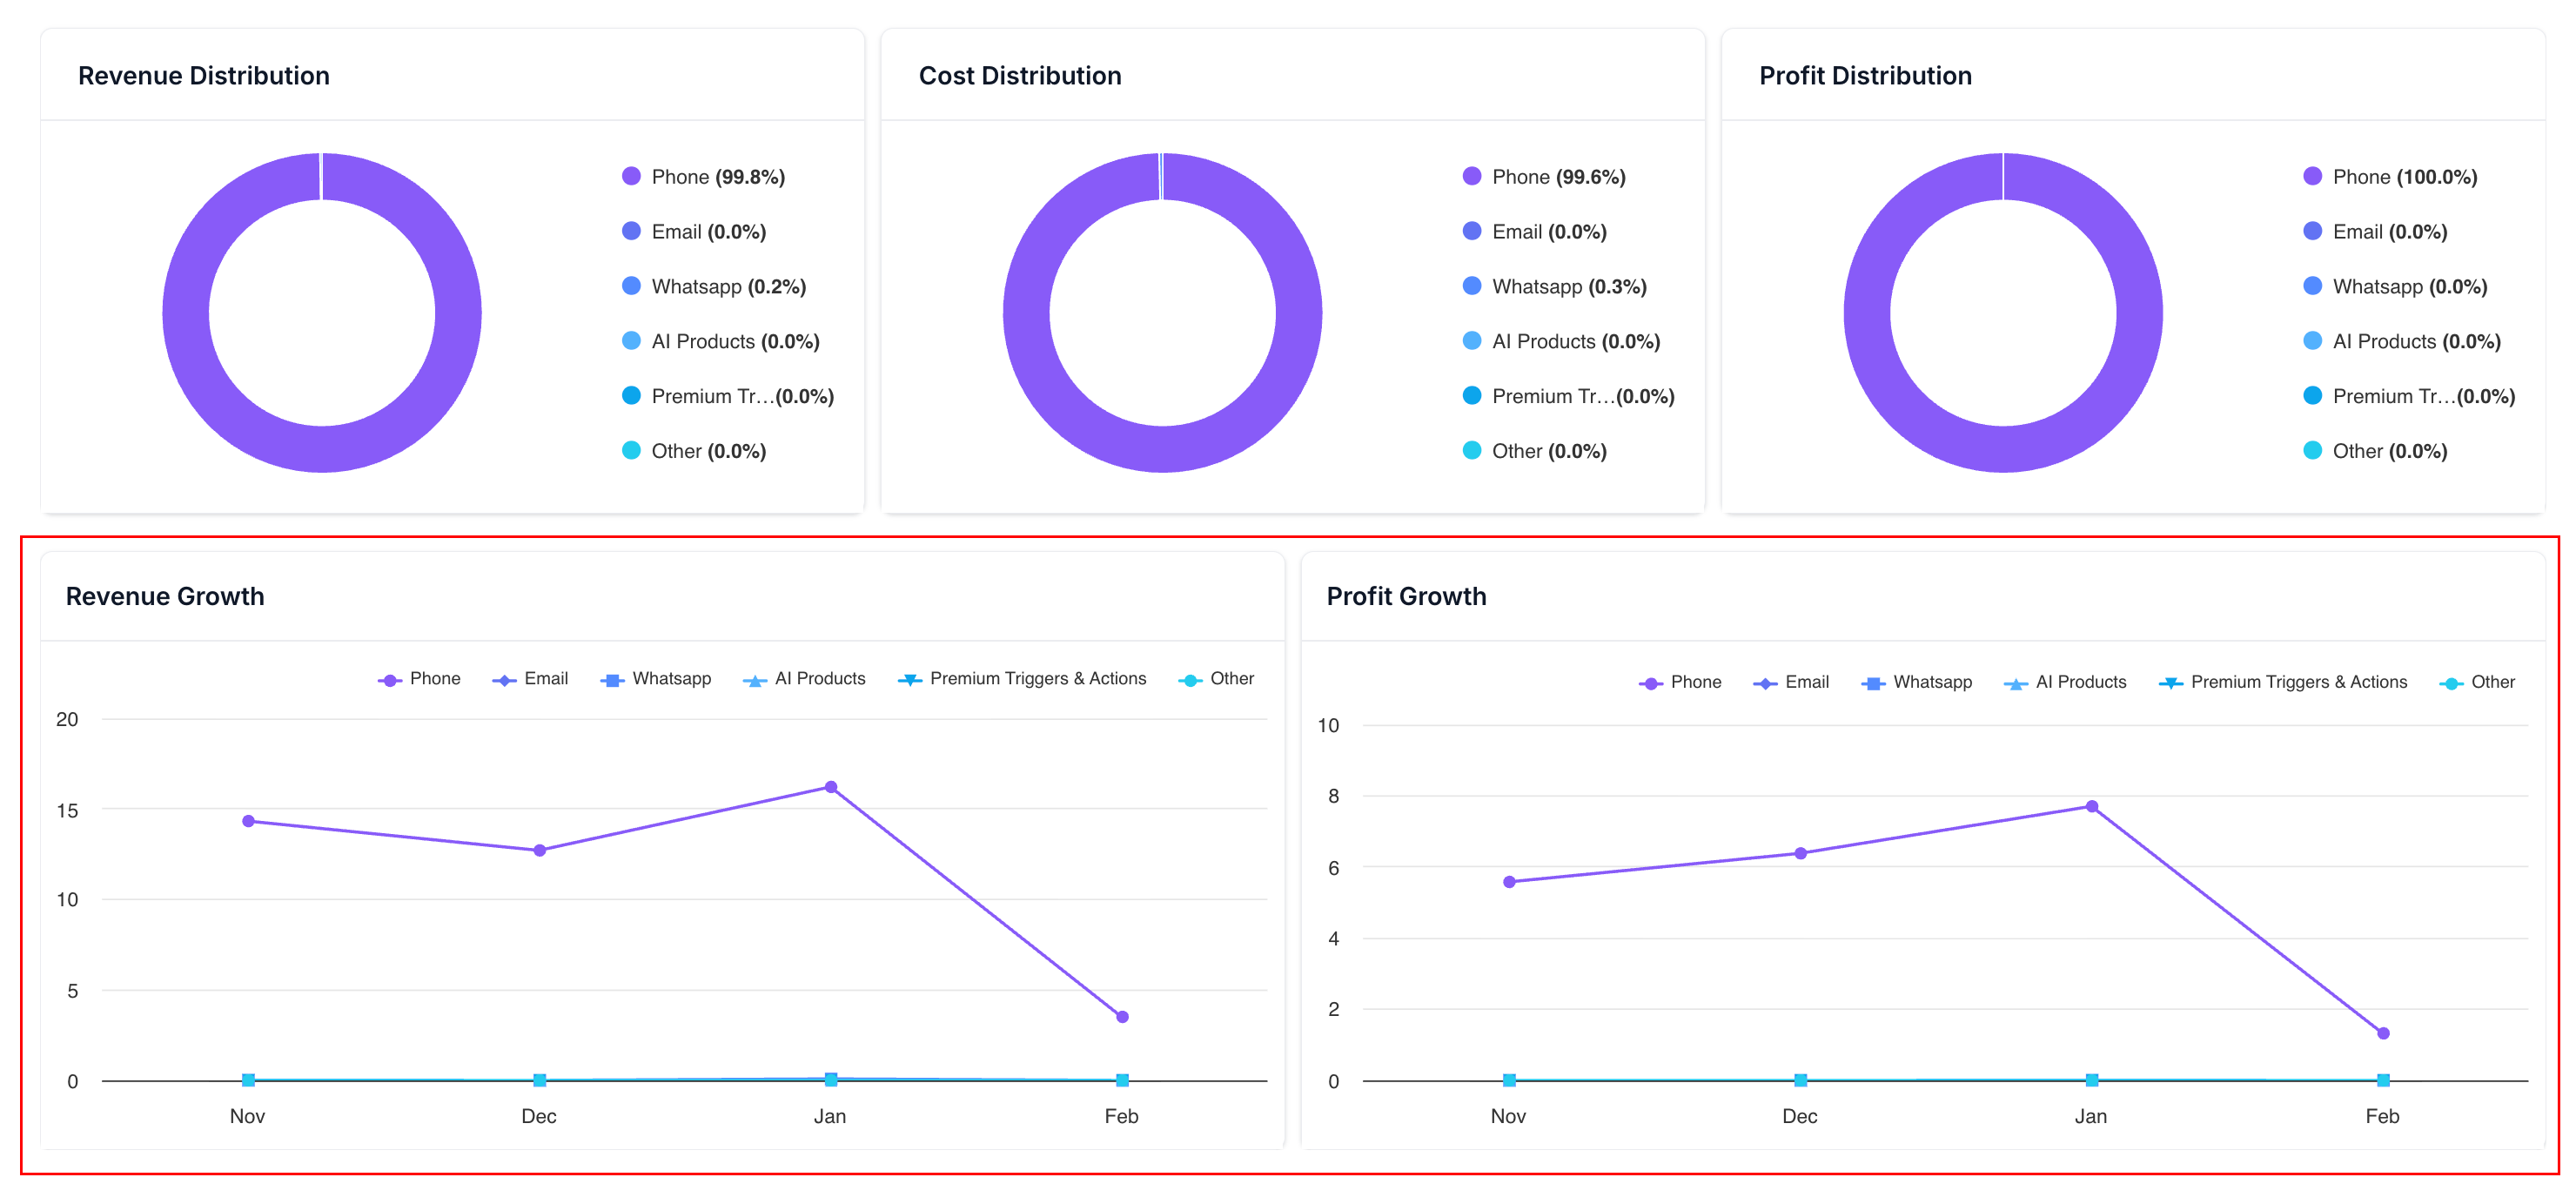
Analyzing how these products trend over time is also extremely valuable. You can use the line graph below to see how your sales are going for each channel for the defined interval.
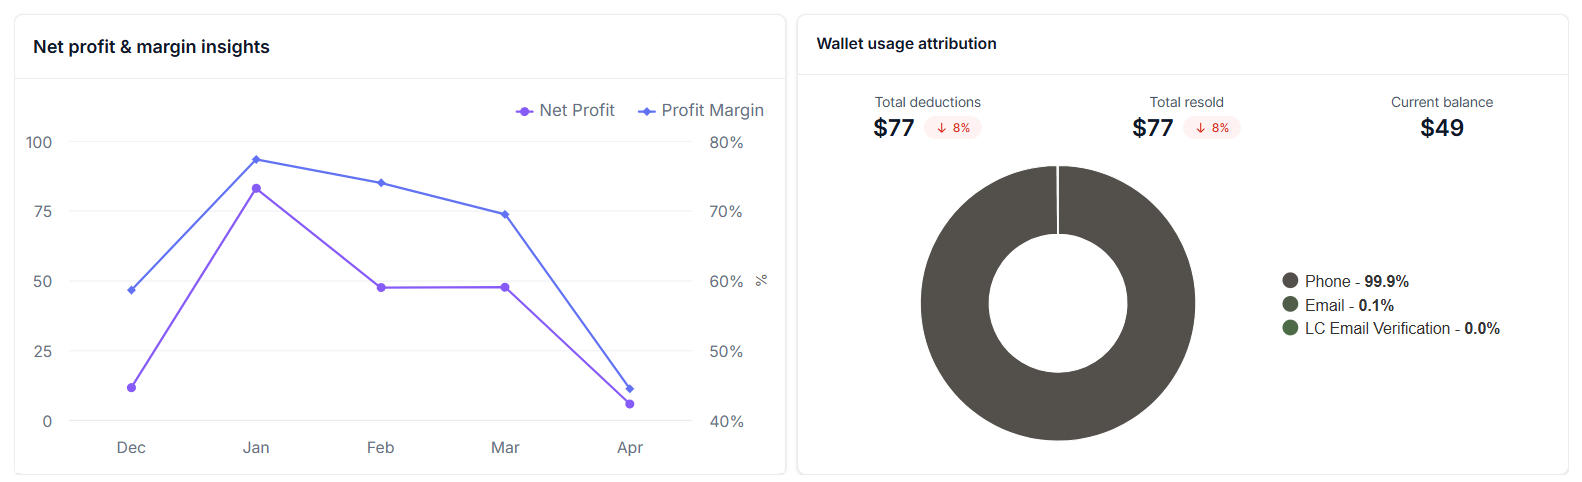
Visualize your income and expenses by using the Net profit & margin insights and Wallet usage attribution widgets.
Subscription Products
This tab focuses on the reselling revenue from subscription products.
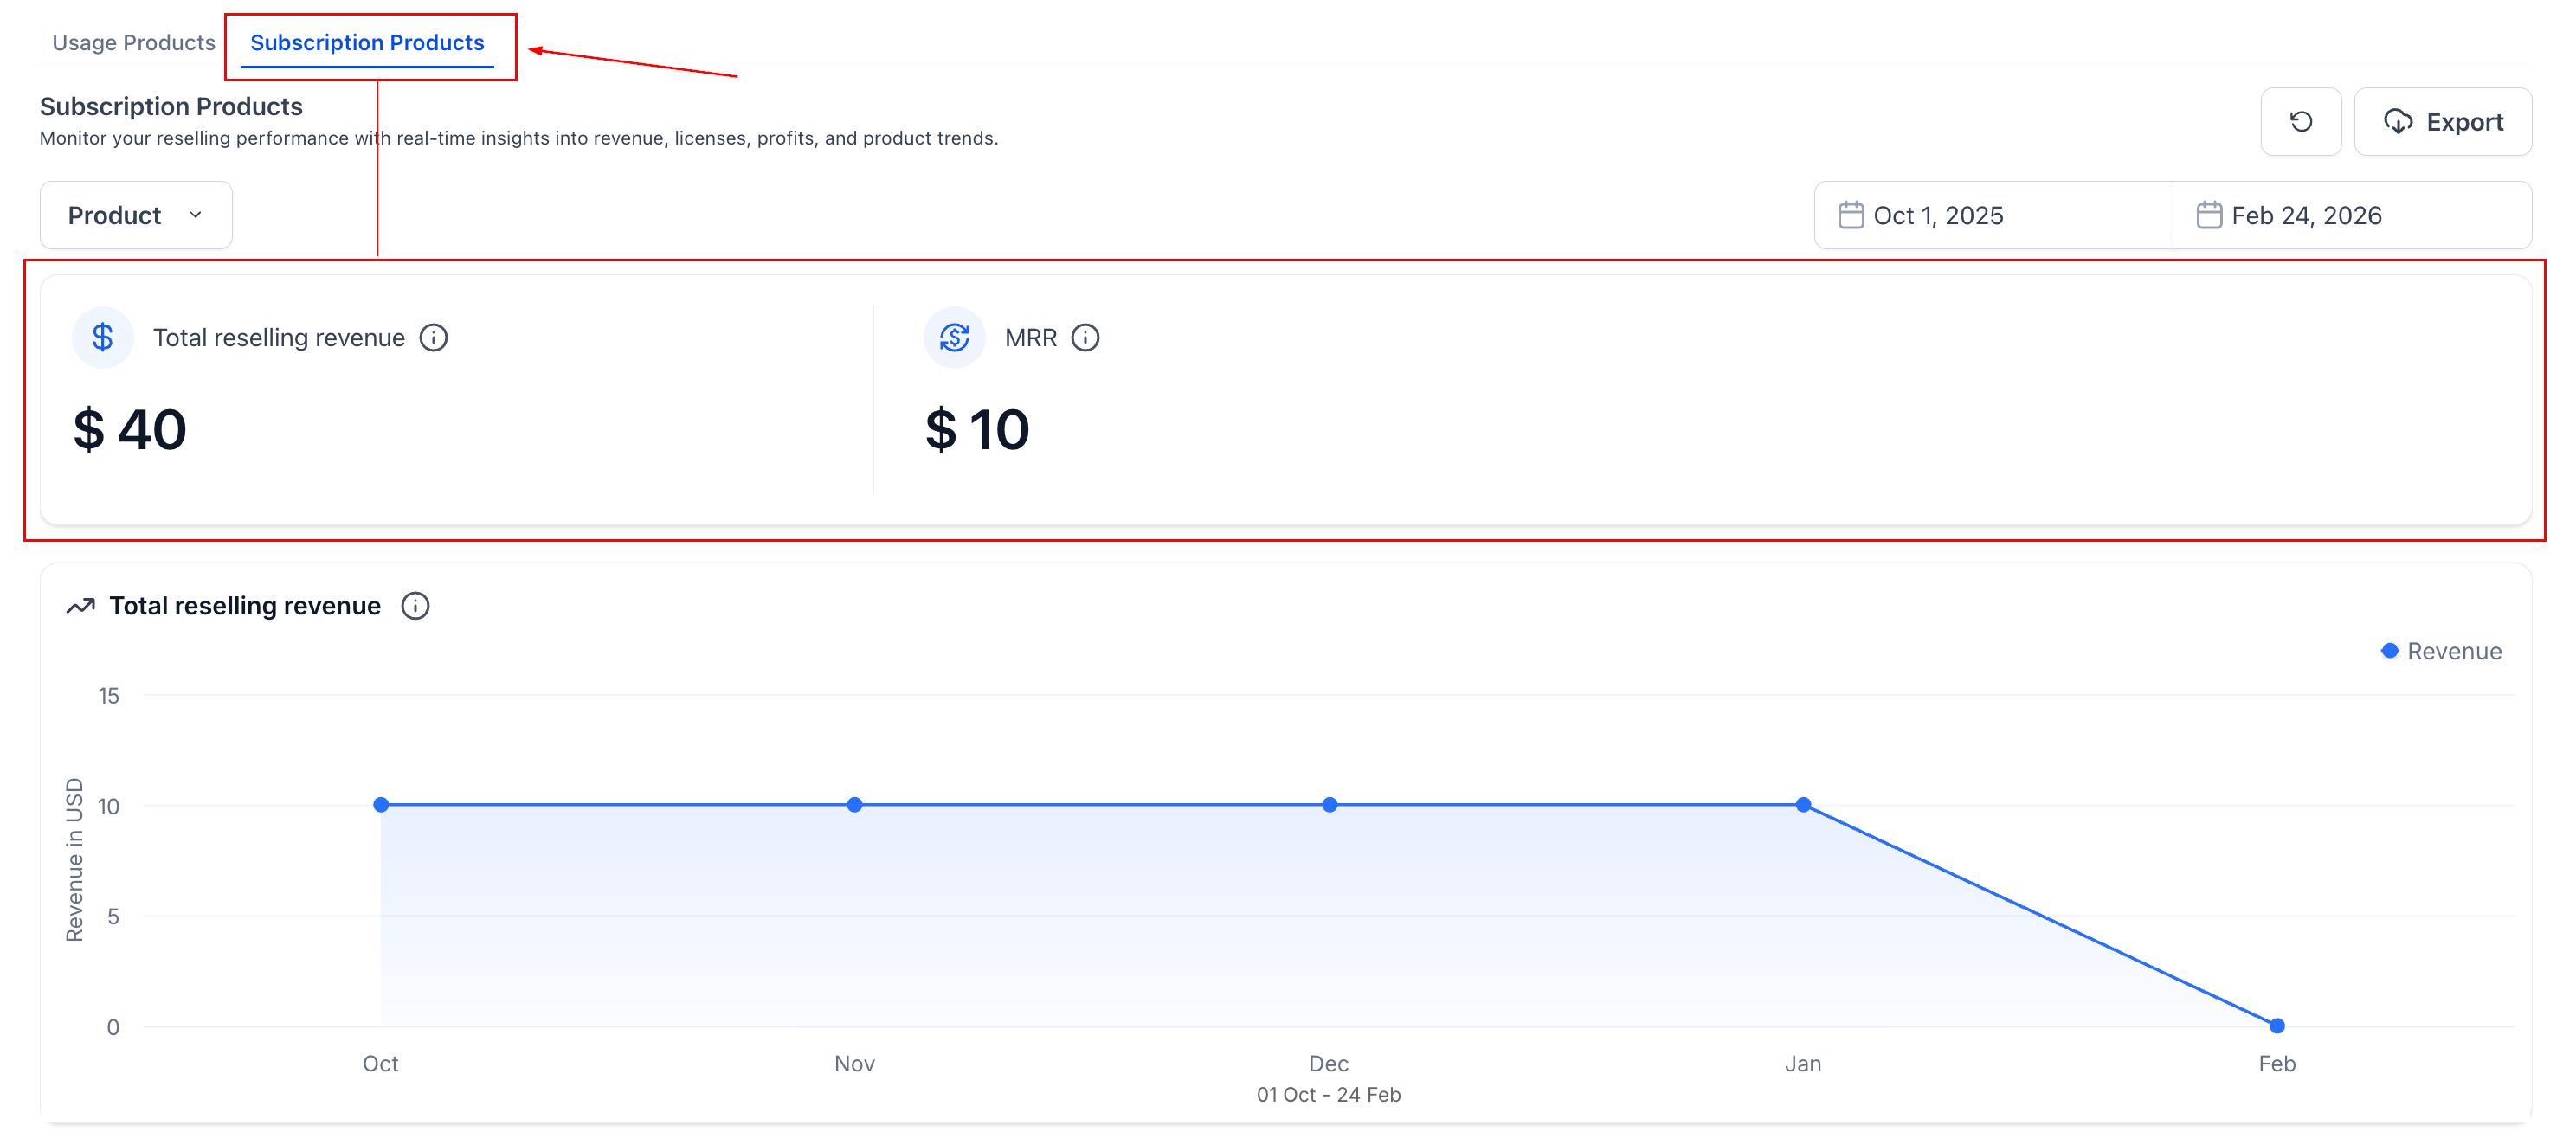
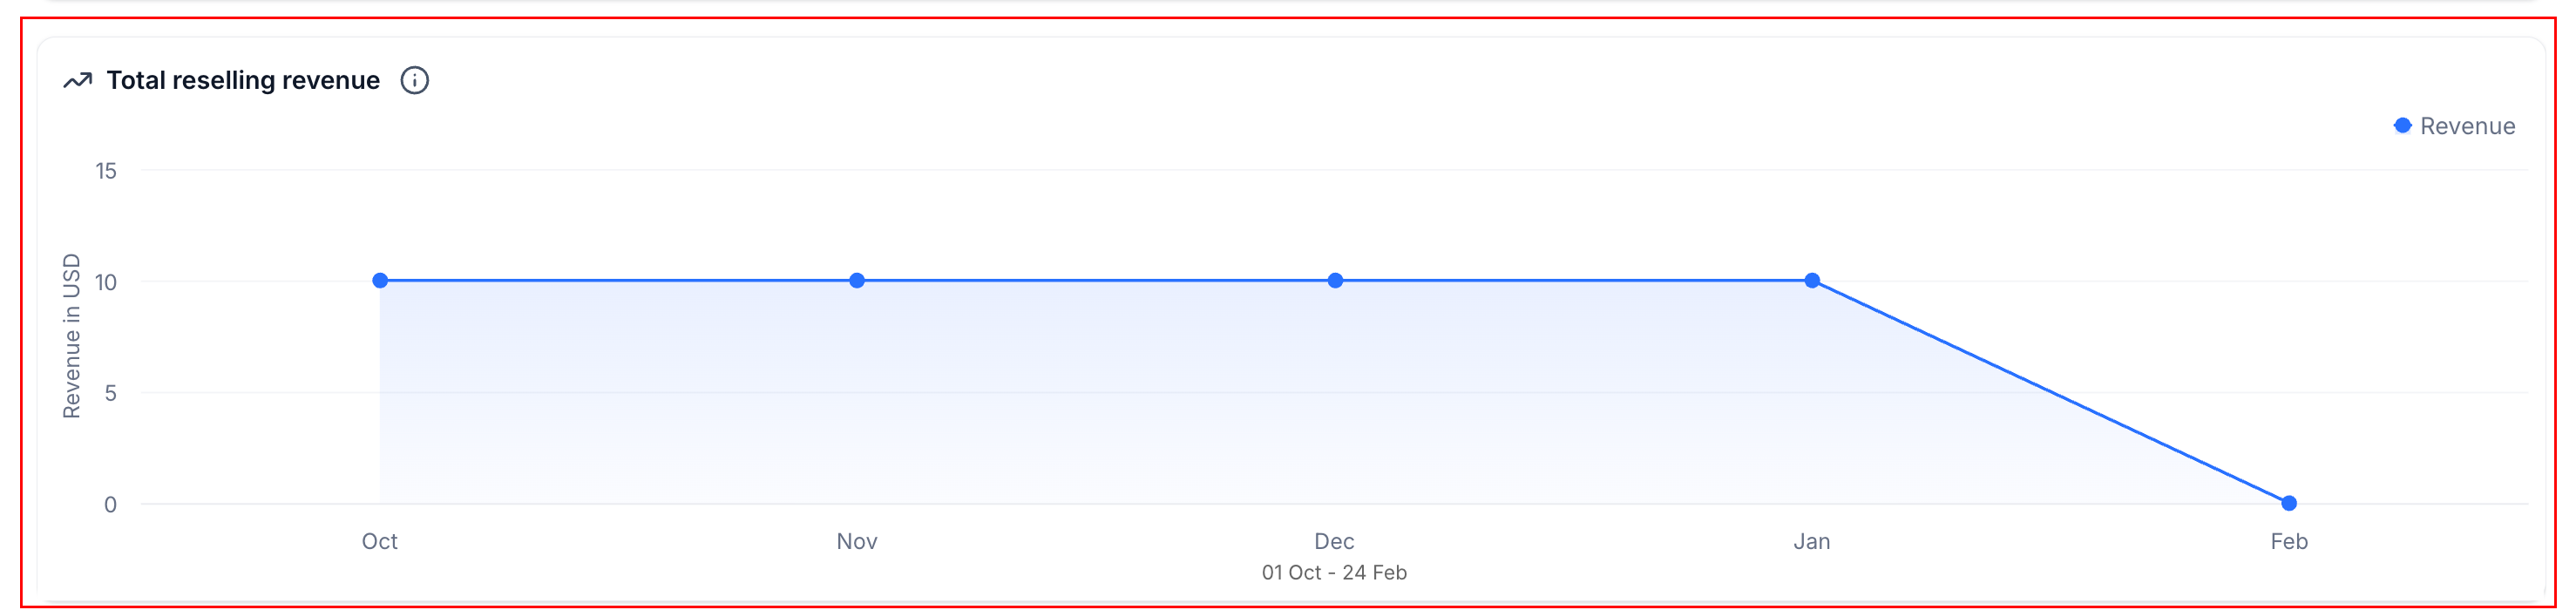
The total reselling revenue chart gives insight into how much USD you are earning in reselling sales per month.
Finally, view the revenue you are earning from each product and the product rankings.
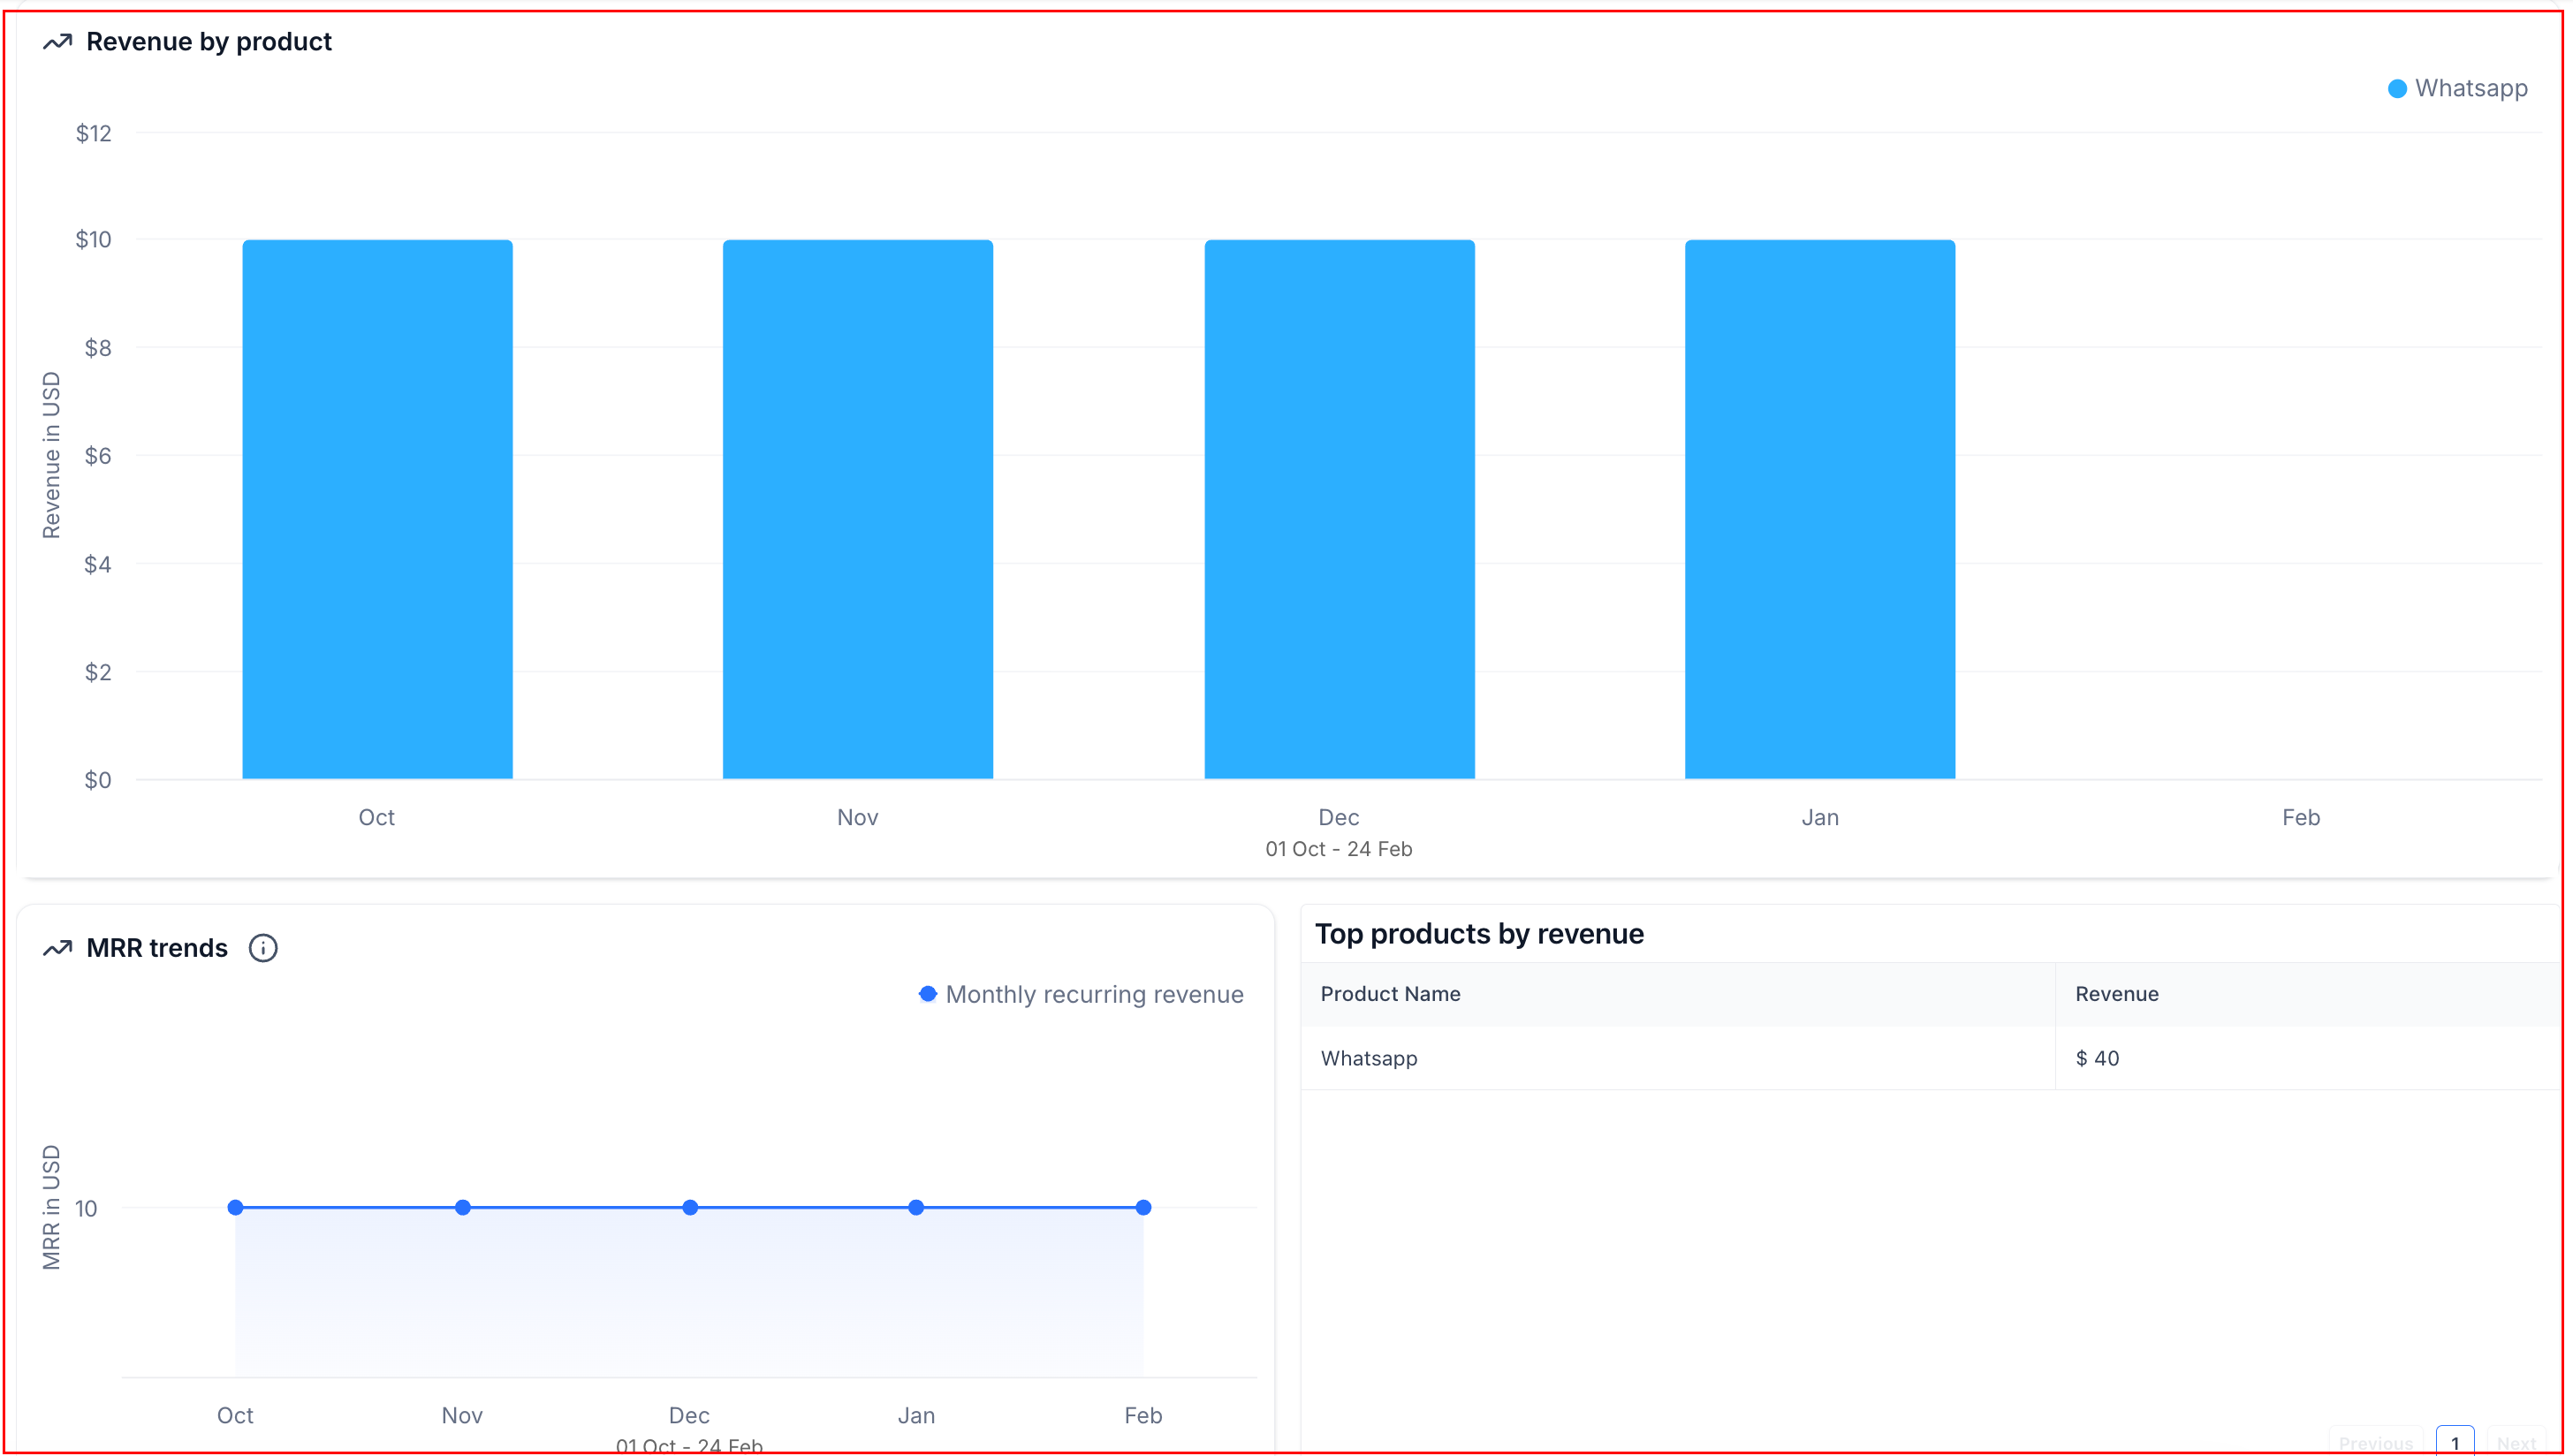
Apply sub-account, product, and date range filters to your metrics and regularly export and refresh these tabs so you can have access to the most accurate information. Now that you know all about the Agency Dashboard, go ahead and leverage the insights to drive your sales even more.