Individual Email Campaign Statistics
The Email section of the CRM offers a detailed look at the statistics related to email campaigns conducted by each user. This includes a breakdown of the total number of emails sent and insights into recipient engagement through metrics such as Sent, Opened, Clicked, and Replied rates. These statistics are crucial for evaluating the performance of your email campaigns and making informed decisions to improve future outreach efforts.
Viewing Statistics
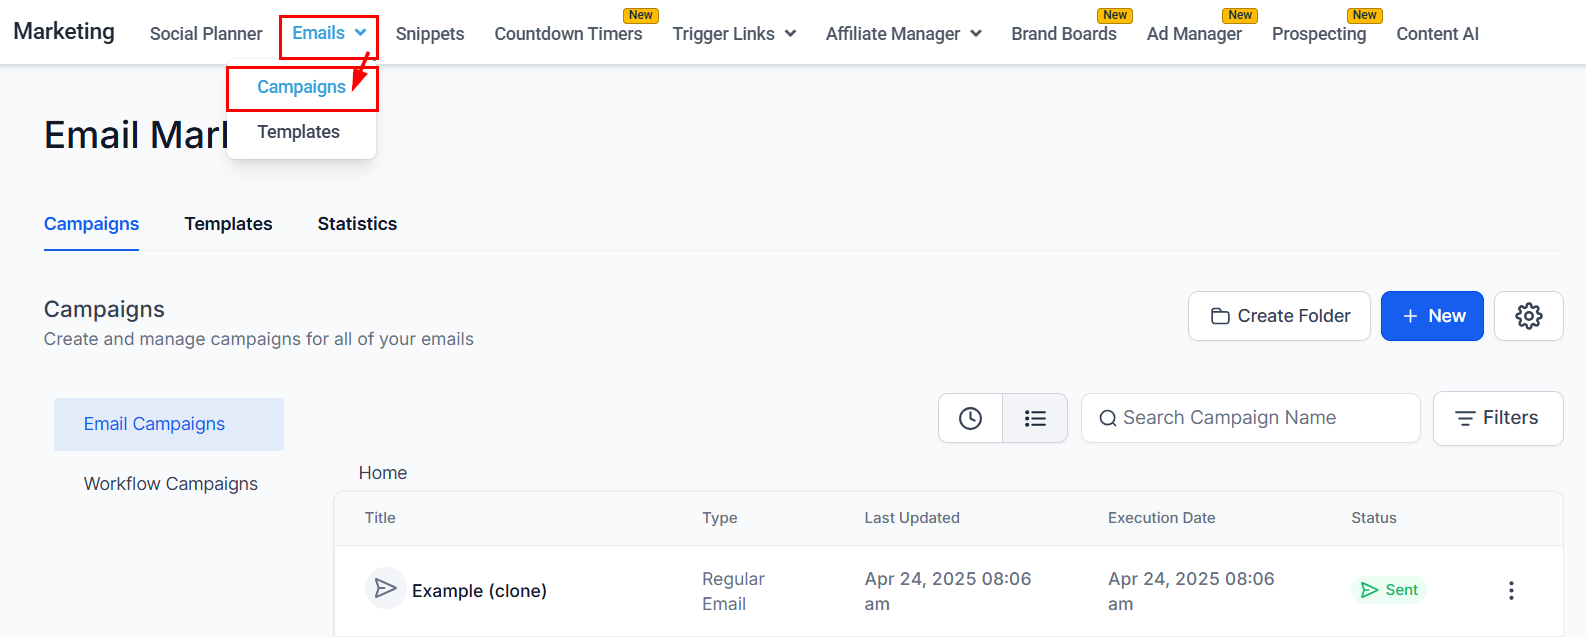
Navigate to the Marketing tab on the left menu, then select “Emails” followed by “Campaigns”.
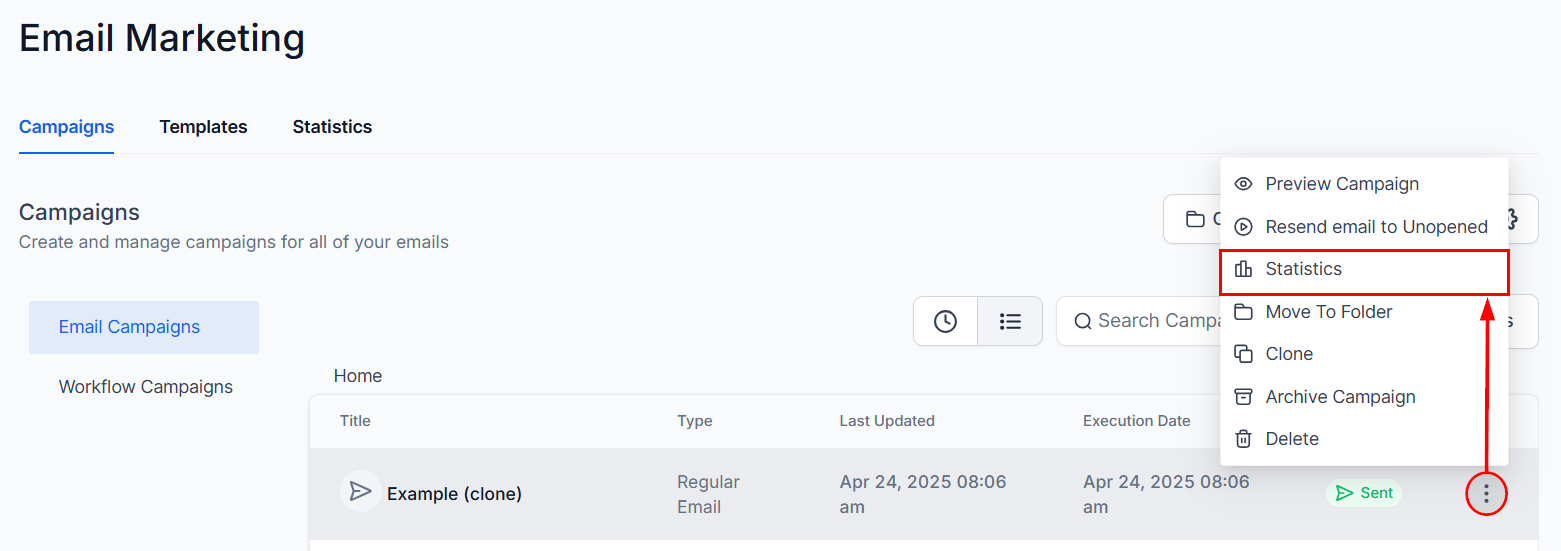
Click on the three dots next to the campaign, then “Statistics” from the actions menu.
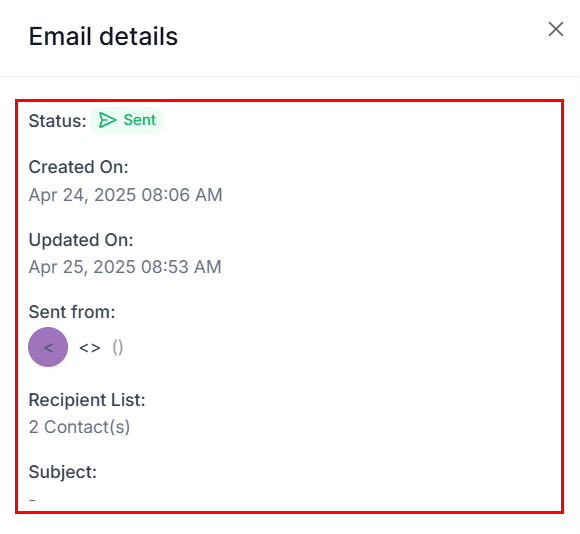
You will first see key details of the campaign, including its current status, creation and last updated timestamps, sender address, total recipient count, and subject line.
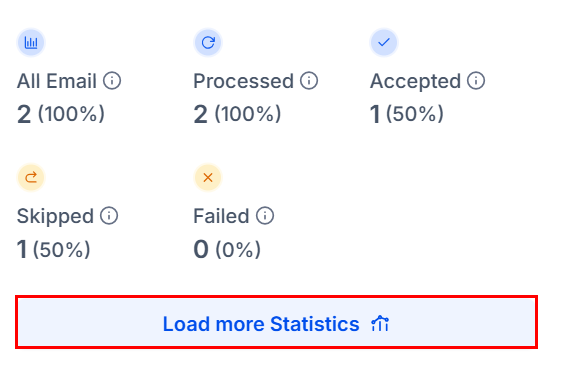
Scroll down to see a brief overview of your email campaign statistics. This summary includes the total number of contacts targeted by the campaign, the number and percentage of emails sent, and the number and percentage of emails that were skipped.
All Email
- Definition: The total number of contacts to whom the email campaign has tried to send an email. This includes all contacts that were scheduled to receive the email, regardless of whether the email was successfully sent, bounced, or skipped.
- Importance: The total metric helps in assessing the initial scope and reach of the campaign. Understanding the total number of attempts can help in planning and allocating resources for future campaigns, ensuring that you have the necessary infrastructure and support to handle your target audience.
Processed
- Definition: The processed metric shows the total number of emails that a user has dispatched over a specific period.
- Importance: Understanding the volume of emails sent helps gauge the scale of your email campaigns.
Accepted
- Definition: The accepted metric shows the total number of valid emails from the batch of emails sent.
- Importance: This metric provides valuable insight into the effectiveness of your email delivery system and the overall health of your email list.
Skipped
- Definition: The skipped metric refers to the number of emails that were not sent to the intended recipients.
- Importance: A significant number of skipped emails can highlight issues with the quality of your email list and could negatively impact your sender’s reputation.
Failed
- Definition: The failed metric displays the number of emails that cannot be delivered due to credit issues.
- Importance: Keeping a close eye on this metric is essential, as unresolved credit issues can hinder email deliverability and potentially impact your sender reputation with email service providers.
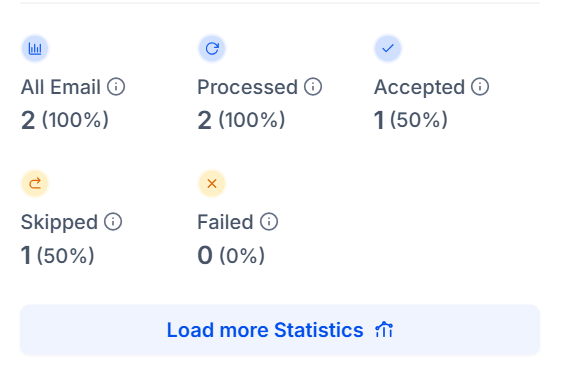
Select “Load more Statistics” to expand the view.
Summary
The summary section shows the key email performance metrics, as per the concern of your email campaign.
Delivered
- Definition: This metric signifies that the email has been successfully accepted by the recipient’s mail server. In SMTP-based tracking, the Opened metric serves as the primary indicator for confirming email delivery.
- Importance: High successful delivery rates mean that your emails are reaching your intended recipients, thereby increasing the chances of engagement.
Opened
- Definition: This metric indicates the amount of emails that were successfully opened by recipients.
- Importance: Tracking open rates is essential for assessing the initial engagement level of your campaigns. A high open rate suggests that your email subject lines are effective in capturing the interest of your audience.
Clicked
- Definition: The Clicked statistic reveals how many recipients engaged with the email content by clicking on links within the email.
- Importance: Click-through rates provide insights into how compelling your email content is and whether it successfully encourages recipients to take the desired action, such as visiting your website or accessing a special offer.
Conversion
- Definition: The “Conversion” metric refers to the number of recipients who completed a desired action after interacting with your email.
- Importance: The conversion rate helps in calculating the return on investment (ROI) of your email campaigns. By linking email activities to actual revenue or other valuable actions, you can assess the financial effectiveness of your campaigns.
Soft Bounced
- Definition: The “Soft Bounce” metric refers to the number of emails that were returned to the sender’s email server because they could not be delivered to the recipient’s inbox temporarily.
- Importance: By analyzing the reasons behind soft bounces, you can take corrective actions to improve email deliverability. For instance, if emails are bouncing due to size, you can reduce the email size or optimize attachments.
Hard Bounced
- Definition: The “Hard Bounce” metric refers to the number of permanently undeliverable email messages.
- Importance: Monitoring hard bounces is important for compliance with email marketing regulations and best practices.
Unsubscribed
- Definition: The “Unsubscribe” metric measures the number of recipients who opt out of your email list
- Importance: The “Unsubscribe” metric in email campaigns is crucial for several reasons, as it provides direct feedback on the recipients’ engagement and satisfaction with your email content and overall email marketing strategy.
Skipped
- Definition: The skipped metric refers to the number of emails that were not sent to the intended recipients.
- Importance: A significant number of skipped emails can highlight issues with the quality of your email list and could negatively impact your sender’s reputation.
Spam
- Definition: The “Spam” metric, also known as the “Complaint” metric, refers to the number or percentage of recipients who mark your email as spam or junk.
- Importance: Low spam rates increase the likelihood that your emails will reach recipients’ inboxes rather than being diverted to spam folders.
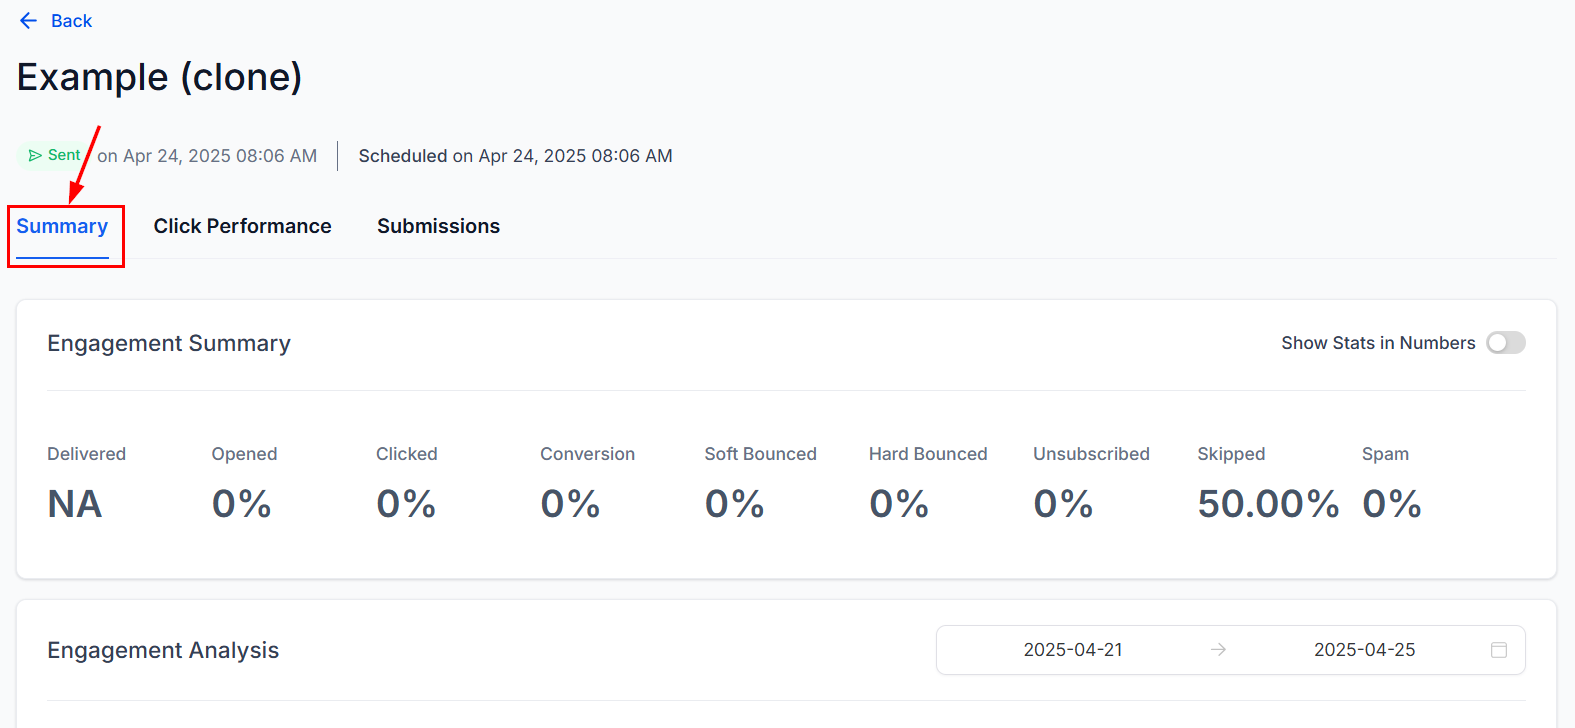
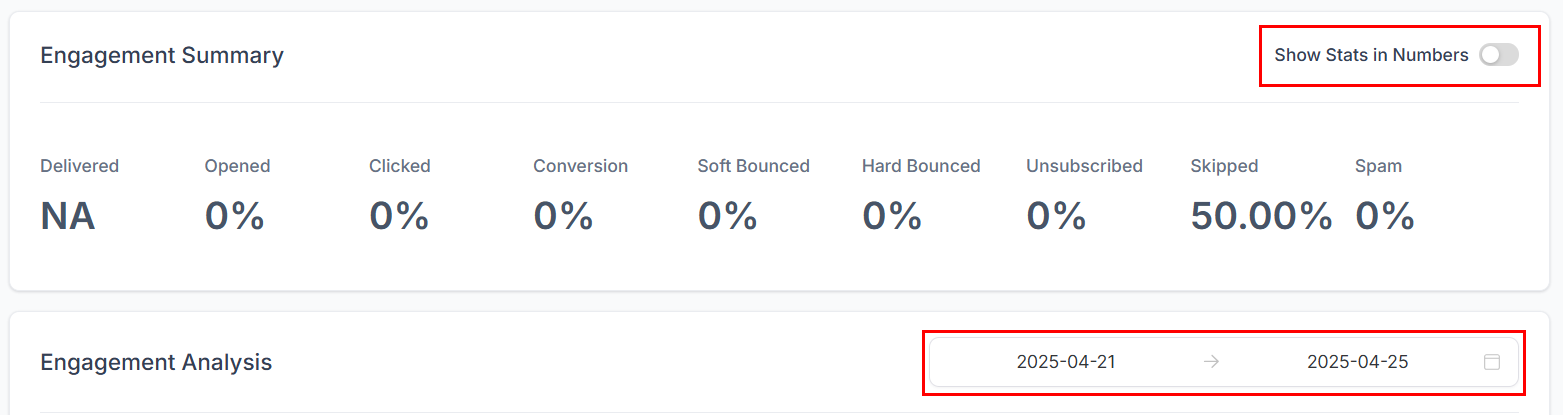
These statistics can be displayed as either numbers or percentages by toggling the view switch. Additionally, you can filter the data by date to support more targeted analysis.
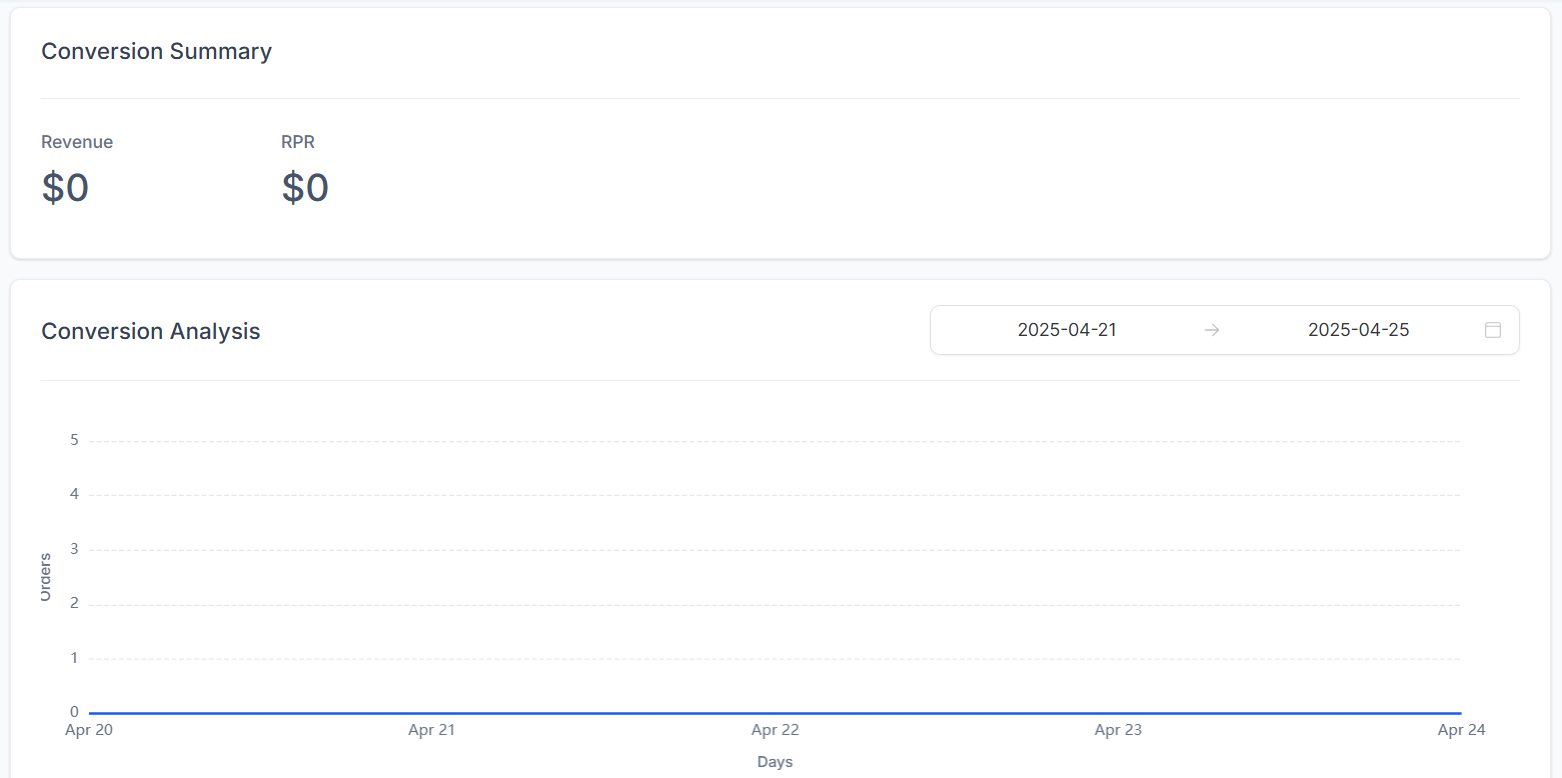
The Conversion Summary displays the Total Revenue Generated and Revenue per Receipt from the email campaign. The accompanying Conversion Analysis presents these insights through a graphical representation for clearer data interpretation and can be filtered by a date range.
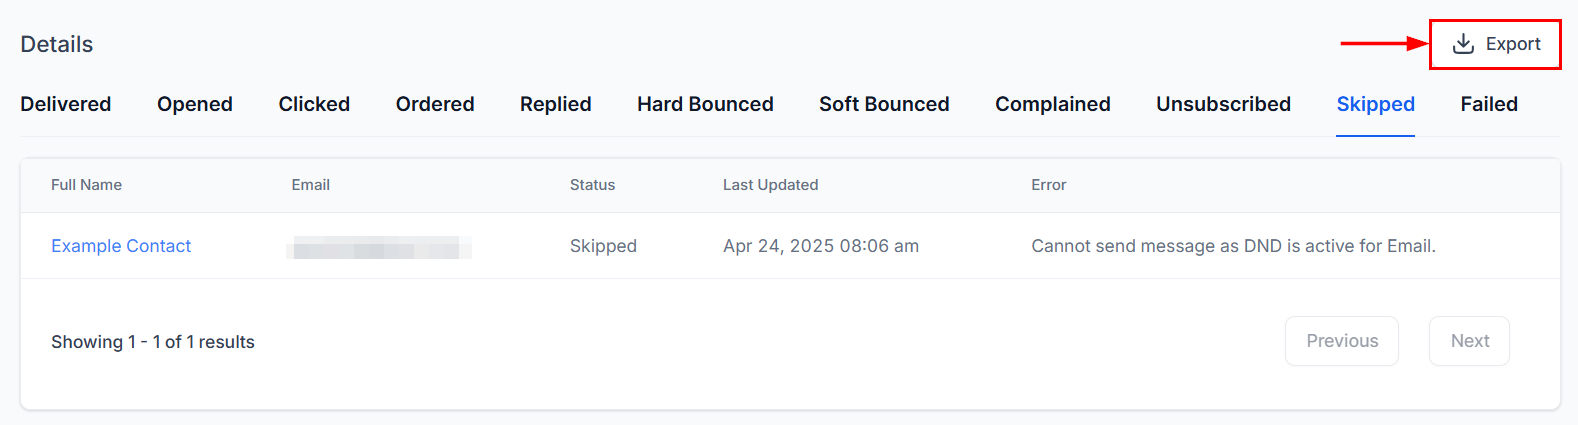
After filtering your data, you can download each section within the “Details” tab as a CSV file by clicking on the “Export” button.
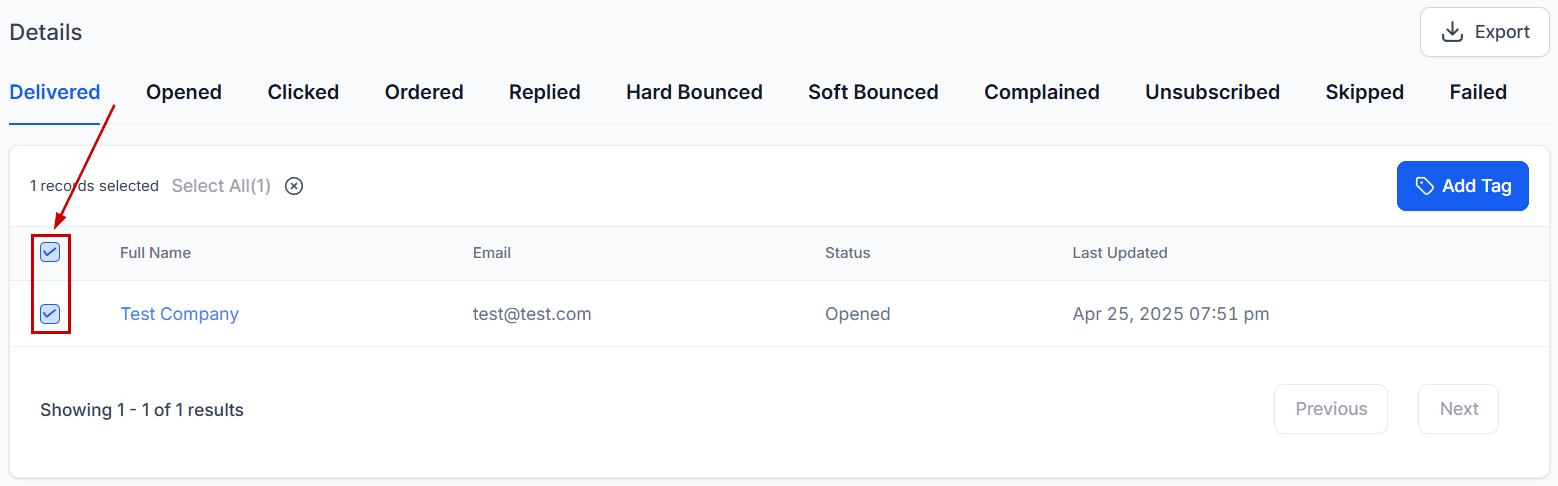
 If you’d like to add tags to contacts who’ve interacted with your email, check the box next to their name.
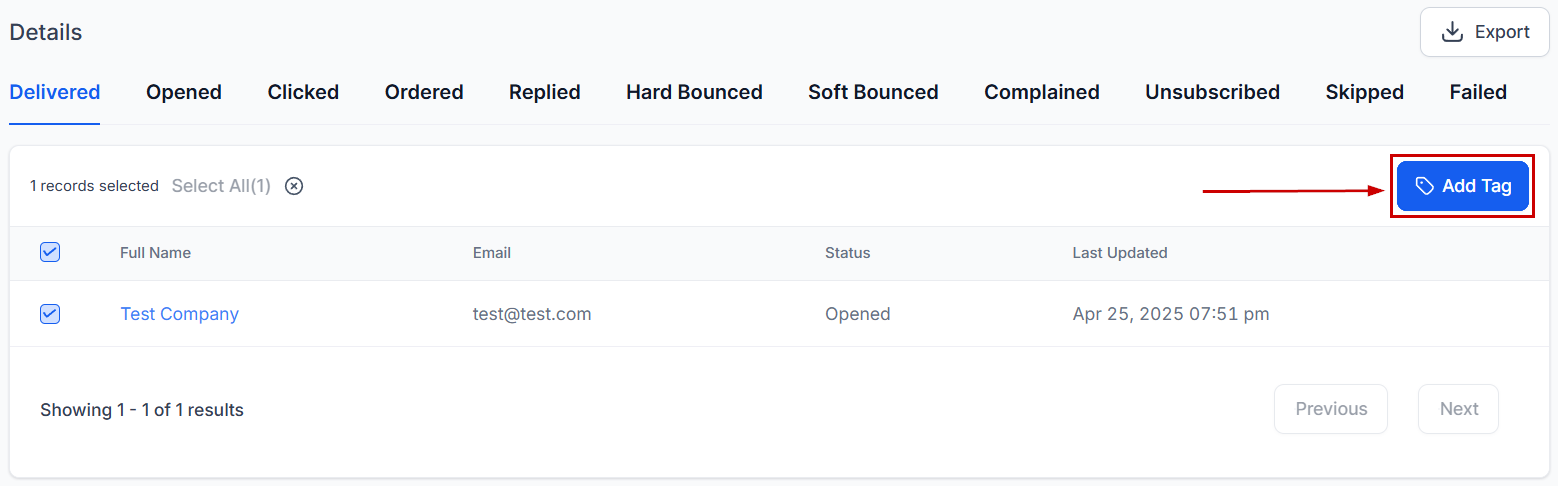
  Click the “Add Tag” button.
 Select your tag (1) and enter a name for the action (2) which will be used to track the bulk action.
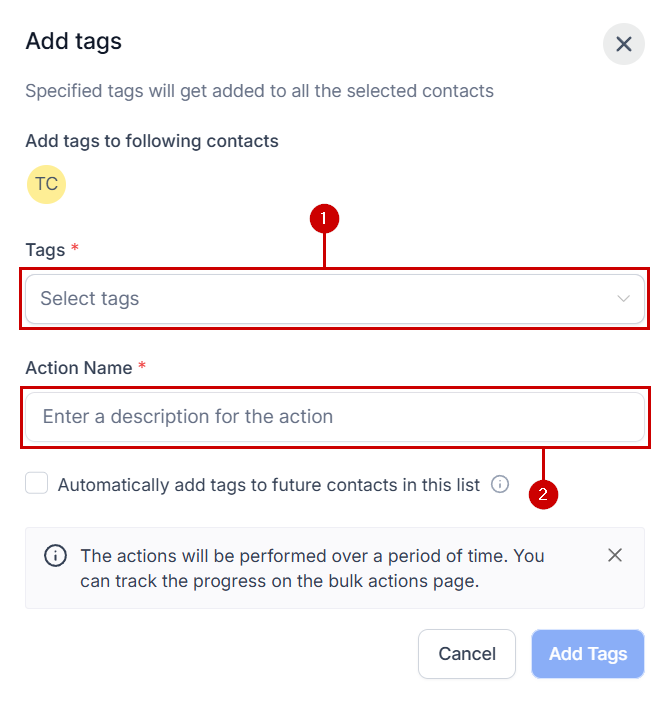 If you want future contact interactions to get the tag added, check the “future contacts” box.
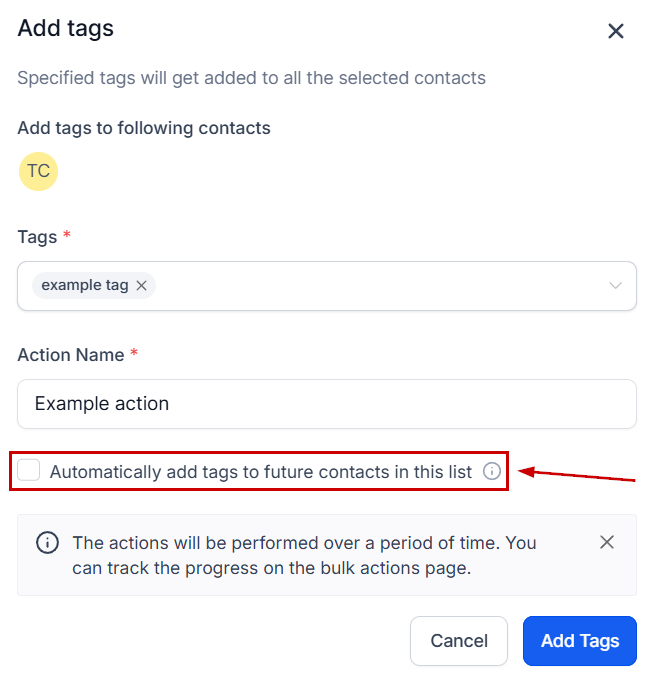 Click “Add Tag” to finalize the process.
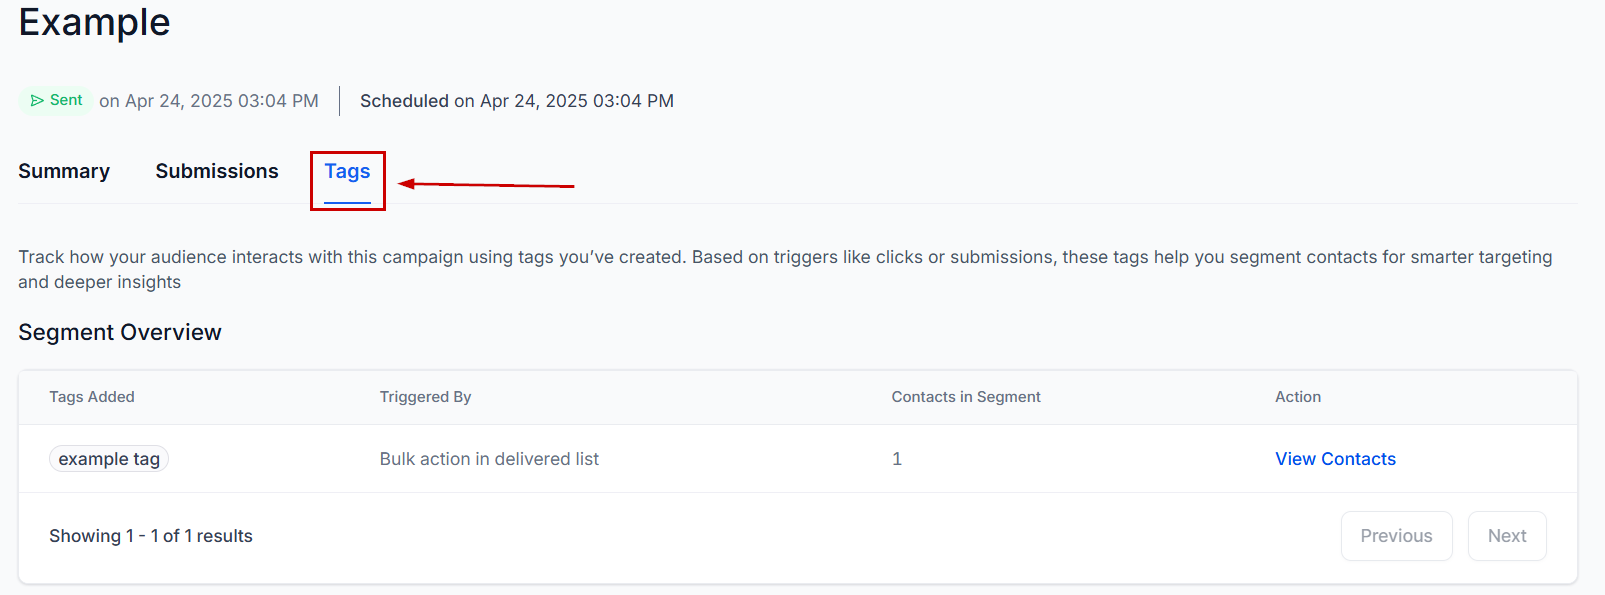
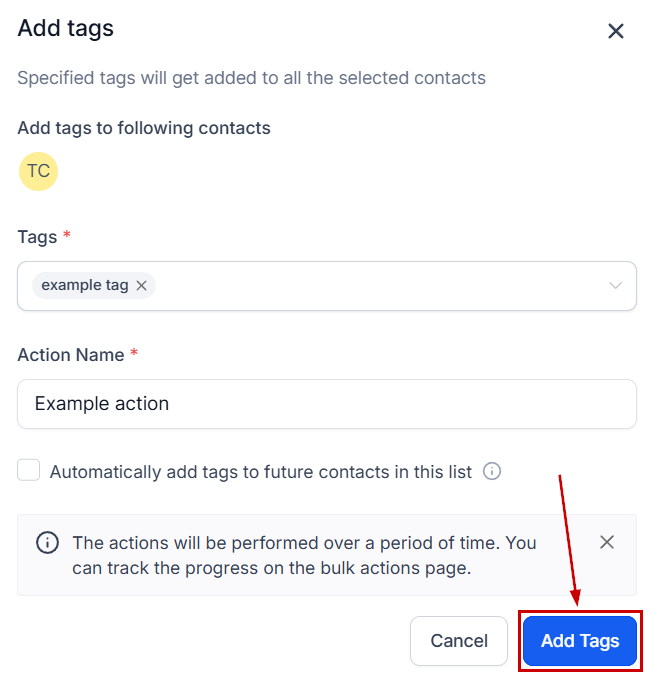 You can monitor the progress of your tagging automation at the top, next to the other metrics.
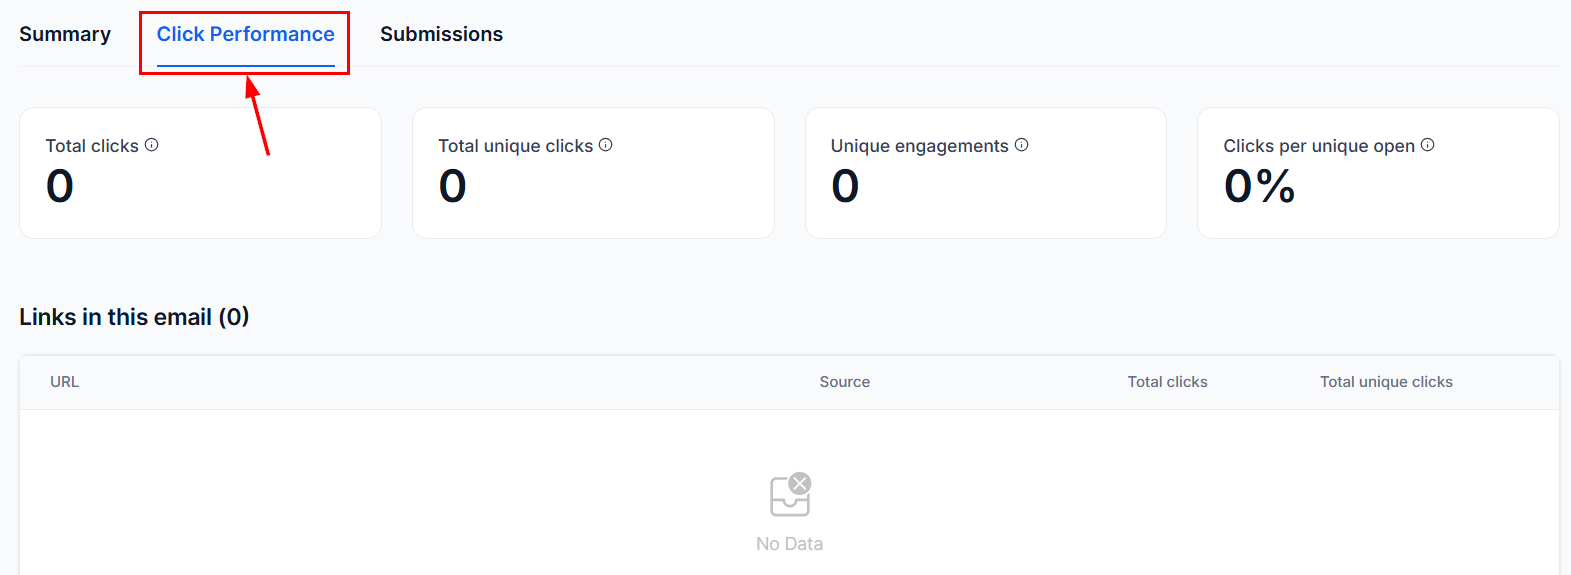
Click Performance
Navigate to the Click Performance tab to access statistics on contact interactions with links included in the email. The Unique Clicks and Engagements metric reflects the number of individual recipients who interacted with at least one link, while Total Clicks represents the overall number of link clicks, including multiple interactions by the same contact.
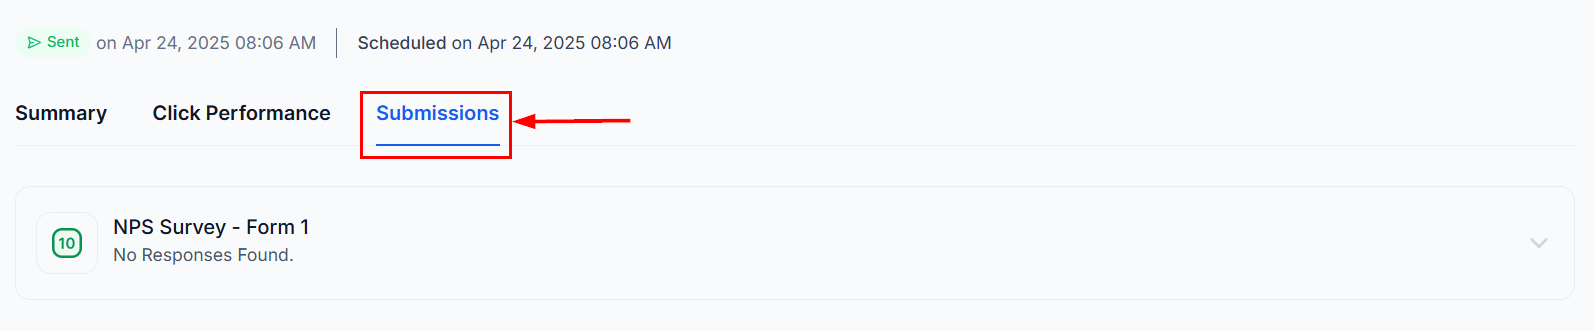
Submissions
In the Submissions tab, you can check for detailed entries received from the Form & Inline Survey Element in your Email Campaign.
Regularly reviewing these statistics enables you to continuously improve your outreach efforts, ensuring long-term success in your email marketing campaigns.
Practical Examples and Use Cases
- Marketing Campaigns: Analyze the open and click rates to determine which email content and subject lines perform best, enabling you to refine future marketing messages.
- Customer Feedback: Use the reply metric to gauge customer interest or concerns regarding a specific product or service, providing valuable insights for product development or customer service improvements.
- Sales Outreach: Evaluate the sent and open rates to optimize the timing and frequency of sales emails, ensuring that your team’s efforts are maximized for engagement.
Frequently Asked Questions
Q: Why are my open rates low?
- A: Low open rates can result from unappealing subject lines or sending emails at suboptimal times. Experiment with different subject lines and scheduling to find what works best for your audience.
Q: How can I improve click-through rates?
- A: Enhance click-through rates by ensuring that your email content is relevant and engaging, with clear calls-to-action (CTAs) that encourage recipients to click.
Not a Funnelbud customer yet?
Try our all-in-one CRM for sales and marketing — free for 7 days, no commitment.