Custom Widgets Overview
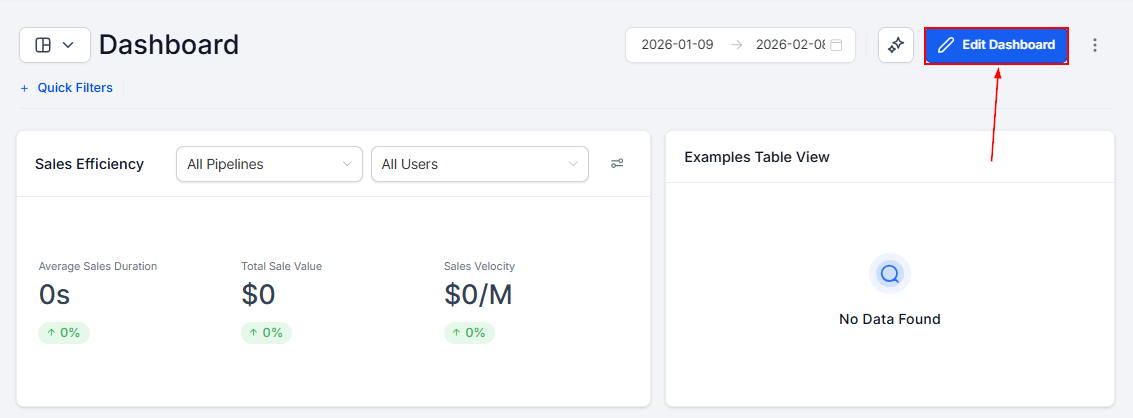
Widgets are versatile, customizable data visualization tools that enable users to efficiently analyze and present their data for enhanced insights and reporting. The main way to view and interact with them is through the dashboard section of your CRM, where you can add, modify, or delete widgets by clicking the “Edit Dashboard” button.
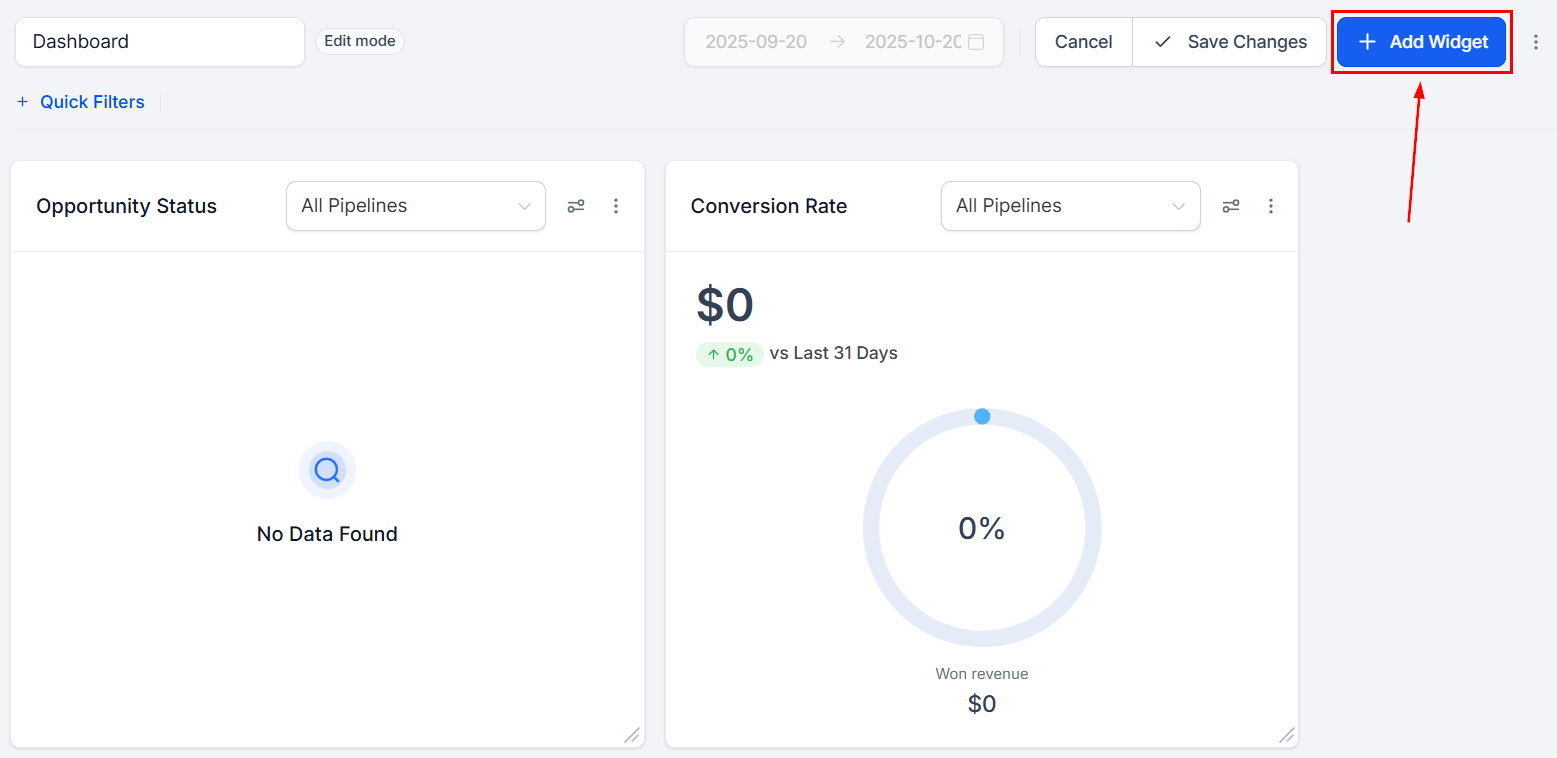
To add a widget, simply click the “Add Widget” button located in the top right corner of your dashboard.
Widget Categories
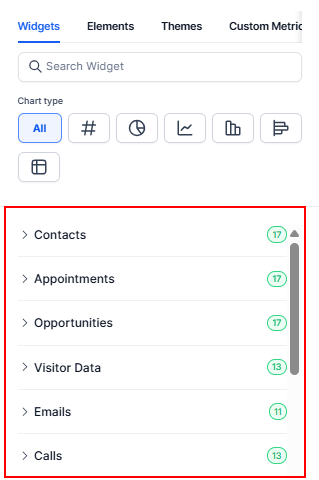
- Contacts: Manage and analyze leads, focusing on tags, activity, or assigned team members.
- Appointments: Track and optimize meetings, view by status or assignee, and monitor appointment trends.
- Opportunities: Gain insights into deal status, monetary value, and progression over time.
- Visitor Data: Analyze visitor interactions and engagement metrics.
- Emails: View key metrics of your emails, such as the number of emails that have been clicked or opened.
- Calls: Monitor call activities, duration, and trends by attendee or status.
- Conversations: Track and analyze communication threads across various channels.
- Payments: Track transactions, revenue trends, and payment statuses to monitor business performance.
- Meta Ads: This helps you track and analyze Meta Ads performance trends effortlessly, making it easier to monitor paid traffic performance at a glance.
- Social Planner: Analyze social media publishing performance, engagement trends, and content activity across connected platforms.
- General: Access predefined performance data across platforms like Google, Facebook, and tasks.
- Google Analytics: View and interpret website performance data, including traffic sources, user behavior, conversion metrics, and engagement trends for data-driven optimization.
- Custom Objects: If you need to manage relationships or processes that go beyond the standard CRM objects, this lets you create object-specific widgets to customize and associate data to get better insights.
Supported Chart Types
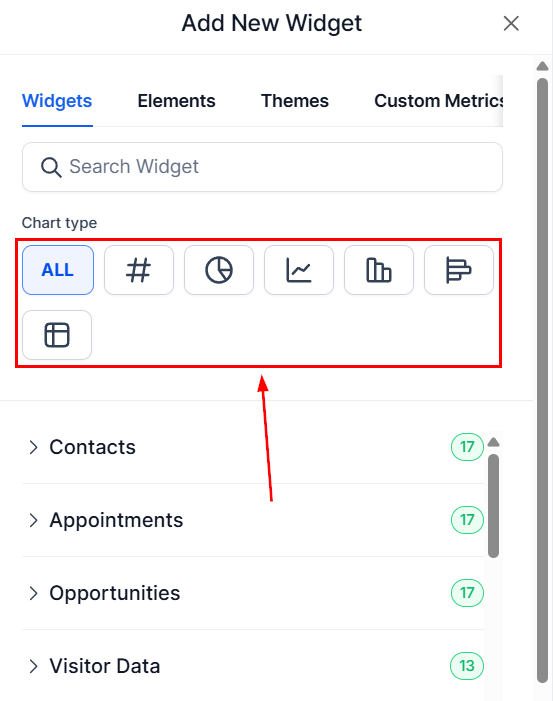
You can select the widget that displays the information in your preferred way by using this top bar. Your options are:
- Numeric/Count
- Donut Charts
- Line Charts
- Bar Charts
- Horizontal Bar Charts
- Tables
Supported Metrics
For widgets that are not specifically designed to provide information on a single metric, such as the total number of items meeting a selected criterion, you can choose from the following metric options:
- Sum: Displays the total value of the selected metric.
- Minimum: Shows the minimum value within the selected data range.
- Maximum: Highlights the maximum value of the selected dataset.
- Average: Provides the average value across the dataset.
- Count: Reflects the total number of items that meet the chosen criteria.
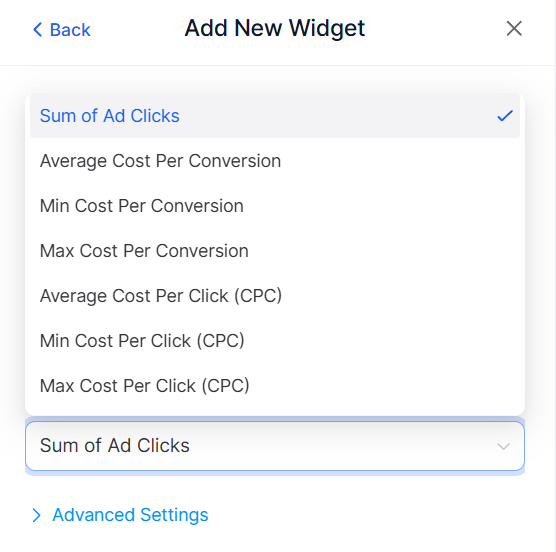
Additionally, for line, bar, and horizontal bar chart widgets, you can add a second metric to enable comparison values, providing deeper insights into your data. These metric options allow you to customize widgets based on your data analysis needs.
Customizing Widgets
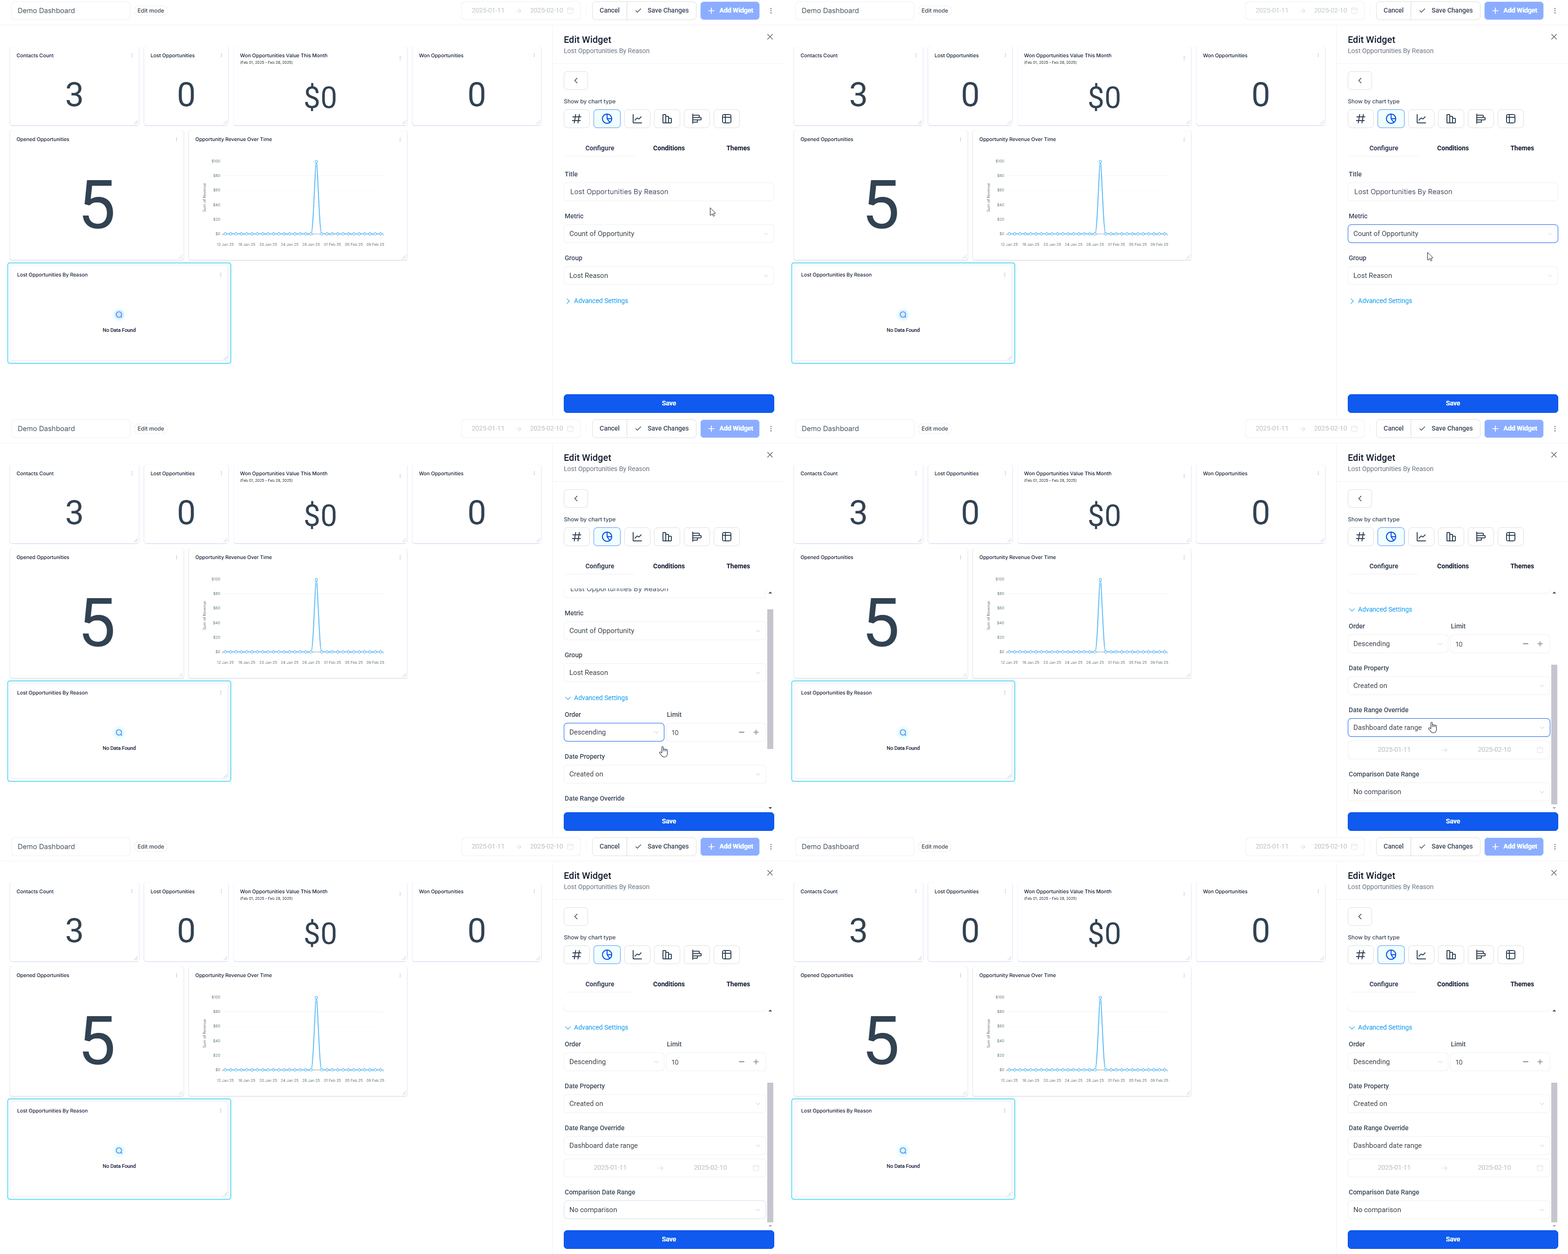
Widgets can be customized with various filters and options to fine-tune your data insights:
- Title: Adjust the widget’s title for clarity.
- Metrics: Choose specific data points for the widget.
- Group: Define groupings for donut charts.
- View By: Select secondary dimensions for bar and line charts.
- Breakdown: Adjust the frequency of intervals (e.g., weekly, monthly).
- Date Property: Select the date property to filter data (e.g., Created Date).
- Date Range Override: Override the default date range from the dashboard.
- Comparison Date Range: Compare data across different periods.
- Order: Display results in ascending or descending order.
- Limit: Set a cap on the number of results displayed.
Widget Condition Operators
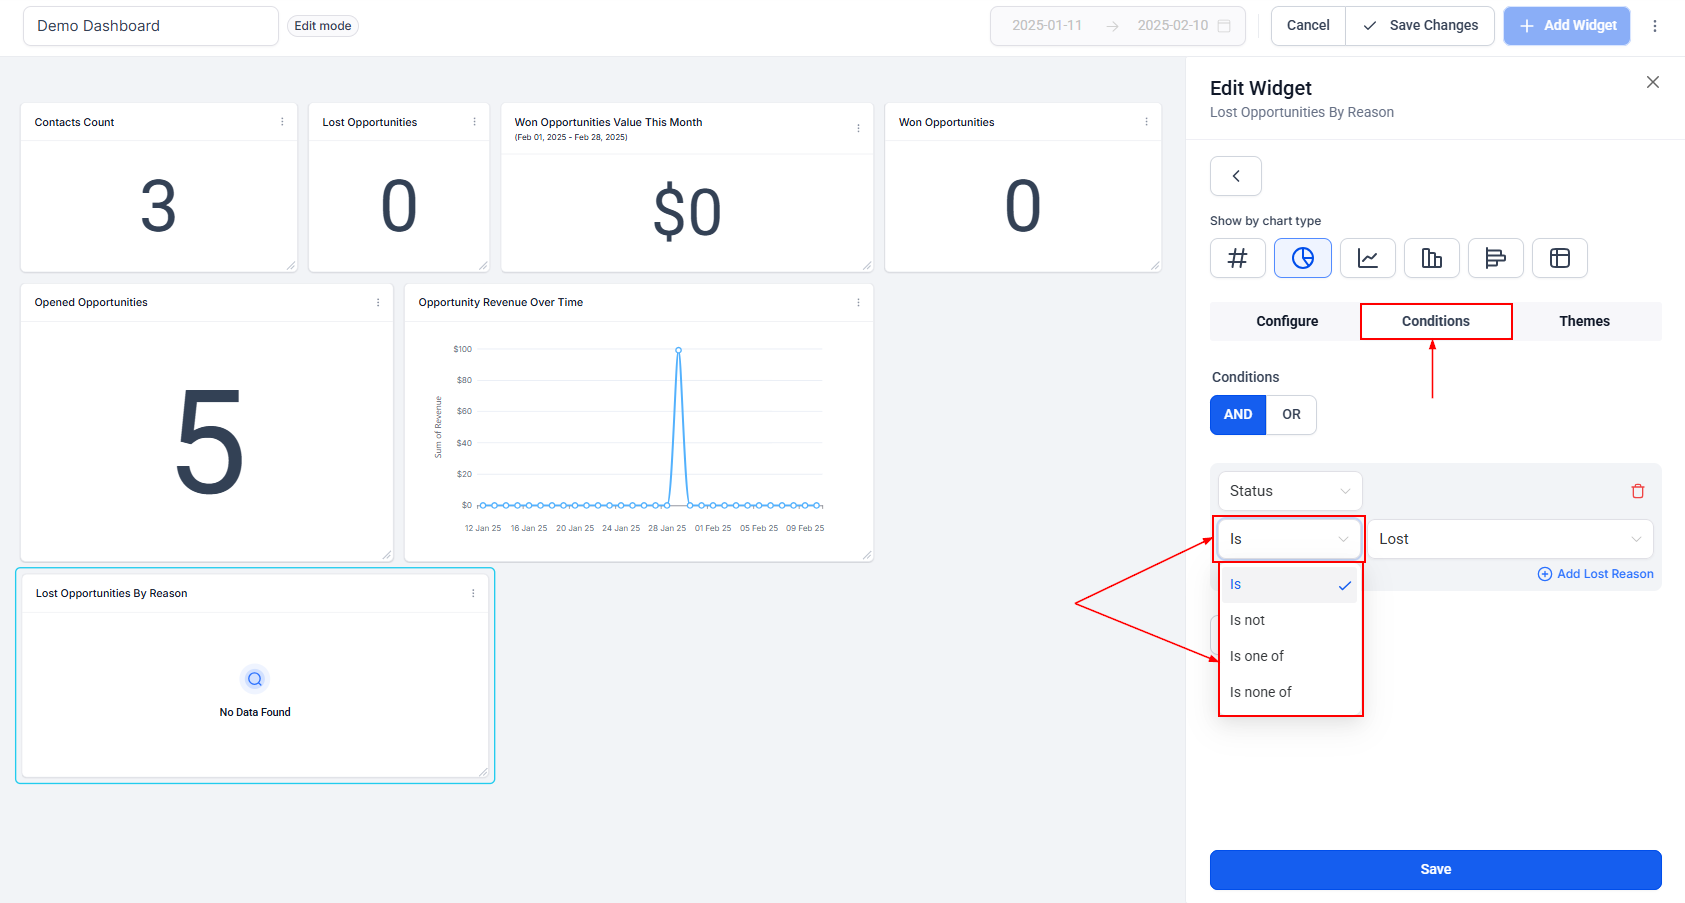
- Is: Select one option.
- Is Not: Exclude one option.
- Is One of: Include multiple options.
- Is None of: Exclude multiple options.
- Is Empty/Is Not Empty
- Is All Off: Include options in an AND condition.
Widget Themes
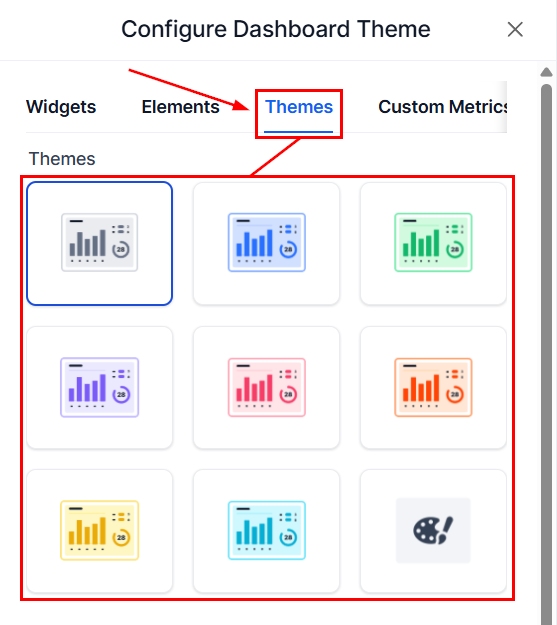
Customize the appearance of your widgets to match your dashboard’s theme and improve visual consistency.
Custom Metrics
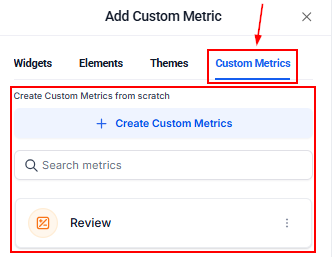
Use Custom Metrics to combine multiple metrics from different data sources, apply calculations, and display the results in your dashboards or custom reports.
With Custom Widgets, you gain complete control over your data visualization, helping you extract valuable insights and drive more informed decisions.
Not a Funnelbud customer yet?
Try our all-in-one CRM for sales and marketing — free for 7 days, no commitment.